OPEN-SOURCE SCRIPT
已更新 First In, First Out Moving Average
This script is a tool designed to calculate a First In, First Out (FIFO) Moving Average (MA) using traded prices and volumes. Additionally, it computes the Point of Control (PoC) from, which identifies the price levels (developing POC) with the maximum volume. The script is built to provide traders with a comprehensive analysis of price movements and volume dynamics, enhancing their understanding of market trends and potential entry/exit points.
Understanding the Mechanics:
The script maintains arrays for prices and volumes, where hypothetical trades are added.
For long trades (identified by red candles/bars), traded prices and volumes are appended to the respective arrays.
Short trades (identified by green candles/bars) trigger the removal of volumes from the arrays following the FIFO principle.
This process ensures the adjustment of partial or complete removal of oldest entries based on traded volume.
Analyzing Profit and Loss (PnL):
The script also tracks a hypothetical Profit and Loss (PnL) to understand whether the outcome is in red (negative) or green (positive) - color of the FIFO MA.
Interpreting the Results:
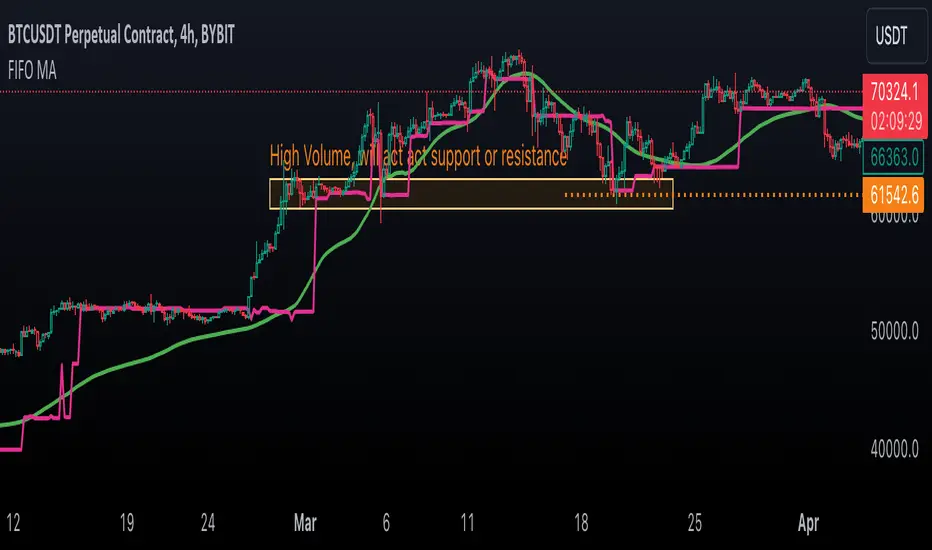
Once the script is applied to the chart, traders can observe the FIFO Moving Average (MA) and Point of Control (PoC) lines plotted.
By analyzing these lines and the associated colors (indicating positive or negative PnL), traders can make informed decisions regarding market trends, support/resistance levels and potential trading opportunities.
Understanding the Mechanics:
The script maintains arrays for prices and volumes, where hypothetical trades are added.
For long trades (identified by red candles/bars), traded prices and volumes are appended to the respective arrays.
Short trades (identified by green candles/bars) trigger the removal of volumes from the arrays following the FIFO principle.
This process ensures the adjustment of partial or complete removal of oldest entries based on traded volume.
Analyzing Profit and Loss (PnL):
The script also tracks a hypothetical Profit and Loss (PnL) to understand whether the outcome is in red (negative) or green (positive) - color of the FIFO MA.
Interpreting the Results:
Once the script is applied to the chart, traders can observe the FIFO Moving Average (MA) and Point of Control (PoC) lines plotted.
By analyzing these lines and the associated colors (indicating positive or negative PnL), traders can make informed decisions regarding market trends, support/resistance levels and potential trading opportunities.
版本注释
Some adjustments to default input settings.版本注释
Code refactor版本注释
Getting close/volume data from lower timeframe now.版本注释
Minor change in "getPoc" function版本注释
getPoc()Enhanced the logic to ensure that the index does not exceed the size of arrayPoc.
版本注释
- Enhanced calculation speed and efficiency in handling FIFO Moving Average and Point of Control.
- Improved time frame handling for better data granularity and accuracy.
- Optimized code for performance gains.
开源脚本
秉承TradingView的精神,该脚本的作者将其开源,以便交易者可以查看和验证其功能。向作者致敬!您可以免费使用该脚本,但请记住,重新发布代码须遵守我们的网站规则。
免责声明
这些信息和出版物并非旨在提供,也不构成TradingView提供或认可的任何形式的财务、投资、交易或其他类型的建议或推荐。请阅读使用条款了解更多信息。
免责声明
这些信息和出版物并非旨在提供,也不构成TradingView提供或认可的任何形式的财务、投资、交易或其他类型的建议或推荐。请阅读使用条款了解更多信息。