OPEN-SOURCE SCRIPT
Relative Strength vs Benchmark SPY

Relative Strength vs Benchmark (SPY)
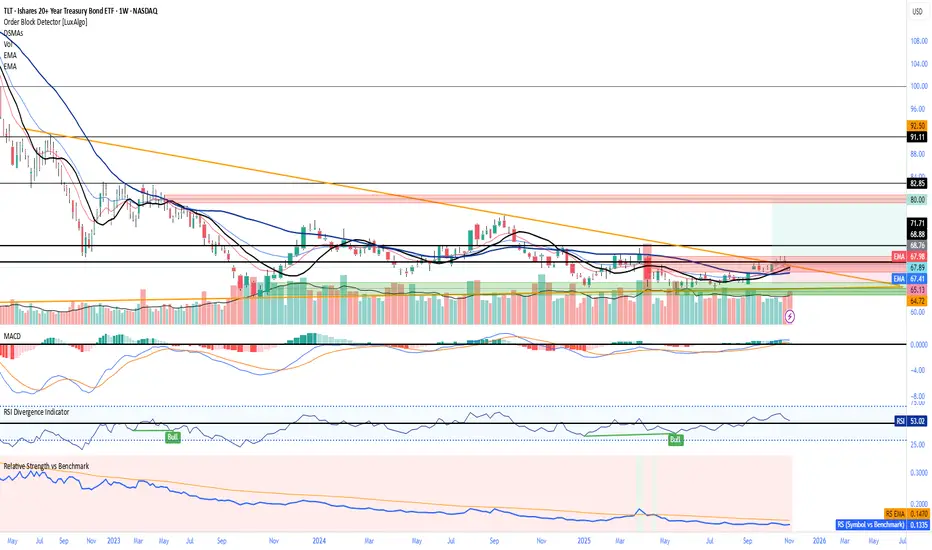
This indicator compares the performance of the charted symbol (stock or ETF) against a benchmark index — by default, SPY (S&P 500). It plots a Relative Strength (RS) ratio line (Symbol / SPY) and its EMA(50) to visualize when the asset is outperforming or underperforming the market.
Key Features
📈 RS Line (blue): Shows how the asset performs relative to SPY.
🟠 EMA(50): Smooths the RS trend to highlight sustained leadership.
🟩 Green background: Symbol is outperforming SPY (RS > EMA).
🟥 Red background: Symbol is underperforming SPY (RS < EMA).
🔔 Alerts: Automatic notifications when RS crosses above/below its EMA — signaling new leadership or weakness.
How to Use
Apply to any stock or ETF chart.
Keep benchmark = SPY, or switch to another index (e.g., QQQ, IWM, XLK).
Watch for RS crossovers and trends:
Rising RS → money flowing into the asset.
Falling RS → rotation away from the asset.
Perfect for sector rotation, ETF comparison, and momentum analysis workflows.
开源脚本
秉承TradingView的精神,该脚本的作者将其开源,以便交易者可以查看和验证其功能。向作者致敬!您可以免费使用该脚本,但请记住,重新发布代码须遵守我们的网站规则。
免责声明
这些信息和出版物并非旨在提供,也不构成TradingView提供或认可的任何形式的财务、投资、交易或其他类型的建议或推荐。请阅读使用条款了解更多信息。
开源脚本
秉承TradingView的精神,该脚本的作者将其开源,以便交易者可以查看和验证其功能。向作者致敬!您可以免费使用该脚本,但请记住,重新发布代码须遵守我们的网站规则。
免责声明
这些信息和出版物并非旨在提供,也不构成TradingView提供或认可的任何形式的财务、投资、交易或其他类型的建议或推荐。请阅读使用条款了解更多信息。