OPEN-SOURCE SCRIPT
Support & Resistance
What is this script ?
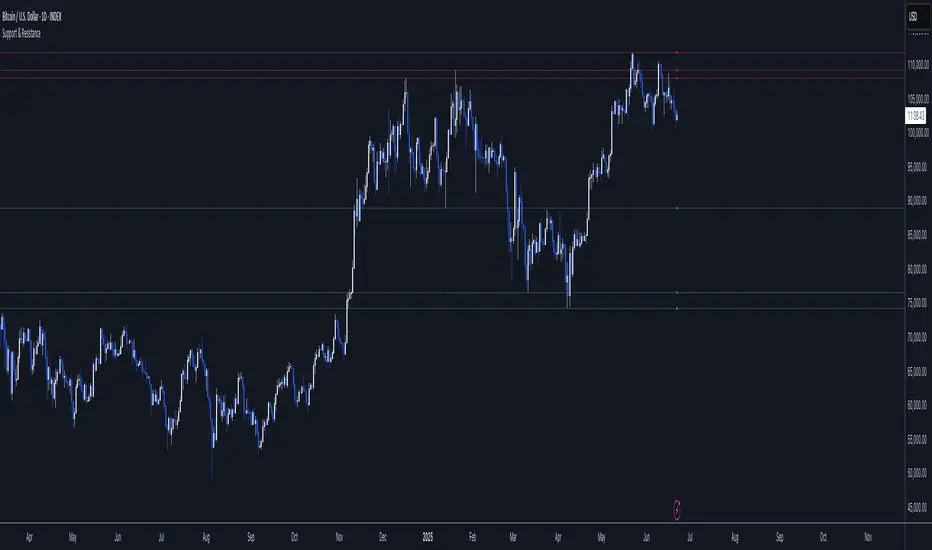
Pivot points are tools used to identify potential support and resistance levels in trading. They are calculated using the previous period’s high, low, and close prices. This script leverages pivot points to plot up to four support levels and four resistance levels, helping traders visualize key price zones.
How to Use the Script?
Support and resistance levels represent price zones where significant liquidity often exists due to past price interactions. These levels are critical for traders to:
- Assess Trend Continuation or Reversal: Prices may pause, reverse, or break through at these levels, signaling potential trend changes or continuations.
- Manage Risk: Support and resistance levels are ideal for placing stop-loss orders or setting profit targets, as they indicate areas where price reactions are likely.
- Plan Entries and Exits: Traders can buy near support levels, sell near resistance levels, or trade breakouts when prices move decisively beyond these zones.
开源脚本
秉承TradingView的精神,该脚本的作者将其开源,以便交易者可以查看和验证其功能。向作者致敬!您可以免费使用该脚本,但请记住,重新发布代码须遵守我们的网站规则。
免责声明
这些信息和出版物并非旨在提供,也不构成TradingView提供或认可的任何形式的财务、投资、交易或其他类型的建议或推荐。请阅读使用条款了解更多信息。
开源脚本
秉承TradingView的精神,该脚本的作者将其开源,以便交易者可以查看和验证其功能。向作者致敬!您可以免费使用该脚本,但请记住,重新发布代码须遵守我们的网站规则。
免责声明
这些信息和出版物并非旨在提供,也不构成TradingView提供或认可的任何形式的财务、投资、交易或其他类型的建议或推荐。请阅读使用条款了解更多信息。