INVITE-ONLY SCRIPT
Axel Smart Trend
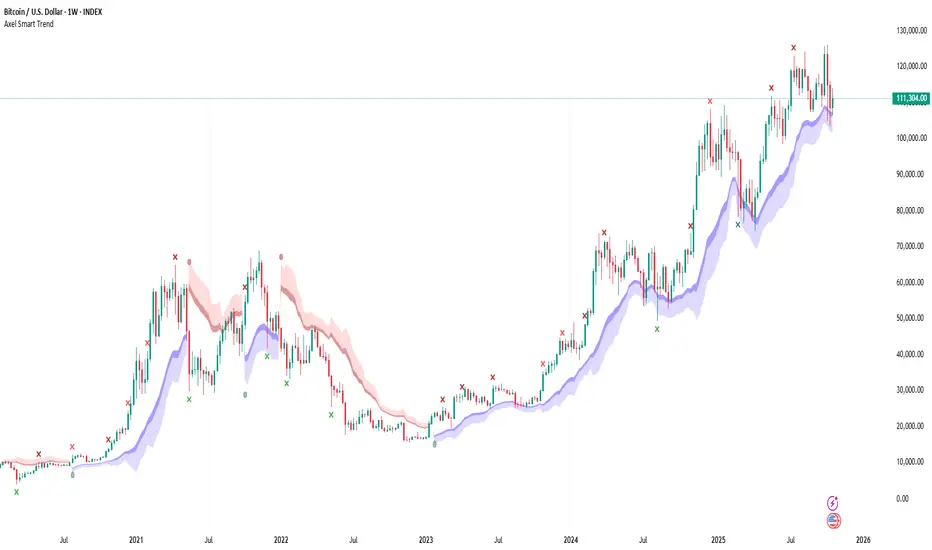
Axel Smart Trend is a dynamic system for identifying and tracking market trends.
It combines ATR-based volatility analysis, EMA smoothing, and Fibonacci-anchored zones to show current trend direction and potential reversal areas.

Axel Smart Trend is a dynamic system for identifying and tracking market trends.
It combines ATR-based volatility analysis, EMA smoothing, and Fibonacci-anchored zones to display current trend direction and key reaction areas.
The indicator adapts to changing market volatility, automatically switching between bullish and bearish phases.
Colored clouds visualize the active trend and act as dynamic support and resistance zones during trend continuation.

Cross markers on the chart highlight moments when the price approaches important cloud levels. These crosses are not buy or sell signals, but rather a visual indication that the market has entered a zone of increased interest.
Main parameters:
The ATR period and multiplier define the sensitivity to volatility.
The EMA length controls the depth of trend smoothing.
Signal strength and cooldown settings adjust the precision and frequency of the markers.
Practical use:
Green crosses tend to appear near potential support areas, while red crosses form near resistance or overbought zones.

The clouds help assess trend strength and possible pullback levels.
Best suited for daily and weekly charts.
Disclaimer:
This indicator is intended for analytical and educational purposes only.
It does not provide financial advice or trading recommendations, and past performance does not guarantee future results.
It combines ATR-based volatility analysis, EMA smoothing, and Fibonacci-anchored zones to show current trend direction and potential reversal areas.
Axel Smart Trend is a dynamic system for identifying and tracking market trends.
It combines ATR-based volatility analysis, EMA smoothing, and Fibonacci-anchored zones to display current trend direction and key reaction areas.
The indicator adapts to changing market volatility, automatically switching between bullish and bearish phases.
Colored clouds visualize the active trend and act as dynamic support and resistance zones during trend continuation.
Cross markers on the chart highlight moments when the price approaches important cloud levels. These crosses are not buy or sell signals, but rather a visual indication that the market has entered a zone of increased interest.
Main parameters:
The ATR period and multiplier define the sensitivity to volatility.
The EMA length controls the depth of trend smoothing.
Signal strength and cooldown settings adjust the precision and frequency of the markers.
Practical use:
Green crosses tend to appear near potential support areas, while red crosses form near resistance or overbought zones.
The clouds help assess trend strength and possible pullback levels.
Best suited for daily and weekly charts.
Disclaimer:
This indicator is intended for analytical and educational purposes only.
It does not provide financial advice or trading recommendations, and past performance does not guarantee future results.
免责声明
这些信息和出版物并不意味着也不构成TradingView提供或认可的金融、投资、交易或其它类型的建议或背书。请在使用条款阅读更多信息。