OPEN-SOURCE SCRIPT
Anchored Moving Averages - Interactive
What is an Anchored Moving Average?
An anchored moving average (AMA) is created when you select a point on the chart and start calculating the moving average from there.
Thus the moving average’s denominator is not fixed but cumulative and dynamic. It is similar to an Anchored VWAP, but neglecting the volume data, which may be useful when this data is not reliable and you want to focus just on price.
Main Features
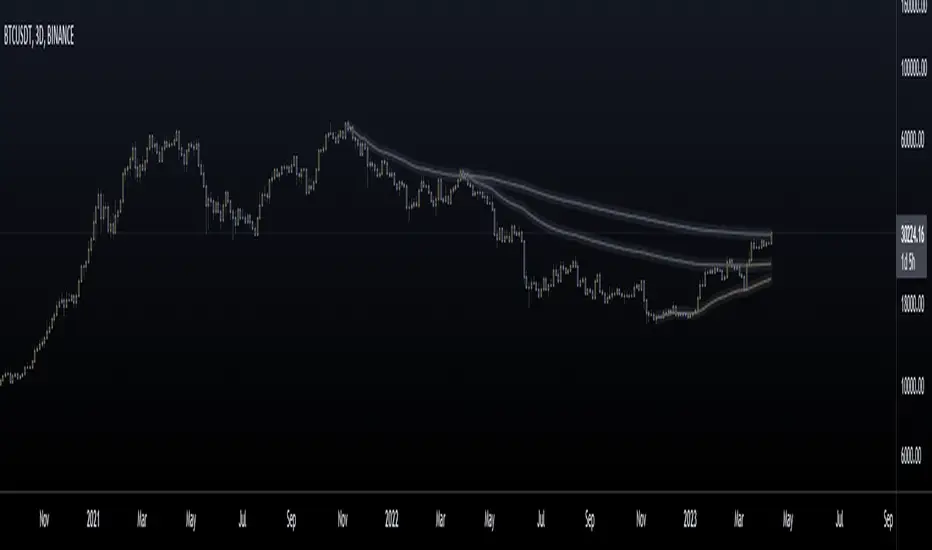
This interactive indicator allows you to select 3 different points in time to plot their respective moving averages. As soon as you add the indicator to your chart you will be asked to click on the 3 different points where you want to start the calculation for each moving average.
Each AMA (Anchored Moving Average) will be colored according to its slope, using a gradient defined by two user chosen colors in the indicator menu.
The default source for the calculation is the pivot price (HLC3) but can also be modified in the menu.
Examples:
https://www.tradingview.com/x/jmMYcz6P/
https://www.tradingview.com/x/ccNFNCL5/
https://www.tradingview.com/x/QOTnW2Ve/
Enjoy!
An anchored moving average (AMA) is created when you select a point on the chart and start calculating the moving average from there.
Thus the moving average’s denominator is not fixed but cumulative and dynamic. It is similar to an Anchored VWAP, but neglecting the volume data, which may be useful when this data is not reliable and you want to focus just on price.
Main Features
This interactive indicator allows you to select 3 different points in time to plot their respective moving averages. As soon as you add the indicator to your chart you will be asked to click on the 3 different points where you want to start the calculation for each moving average.
Each AMA (Anchored Moving Average) will be colored according to its slope, using a gradient defined by two user chosen colors in the indicator menu.
The default source for the calculation is the pivot price (HLC3) but can also be modified in the menu.
Examples:
https://www.tradingview.com/x/jmMYcz6P/
https://www.tradingview.com/x/ccNFNCL5/
https://www.tradingview.com/x/QOTnW2Ve/
Enjoy!
开源脚本
秉承TradingView的精神,该脚本的作者将其开源,以便交易者可以查看和验证其功能。向作者致敬!您可以免费使用该脚本,但请记住,重新发布代码须遵守我们的网站规则。
免责声明
这些信息和出版物并非旨在提供,也不构成TradingView提供或认可的任何形式的财务、投资、交易或其他类型的建议或推荐。请阅读使用条款了解更多信息。
开源脚本
秉承TradingView的精神,该脚本的作者将其开源,以便交易者可以查看和验证其功能。向作者致敬!您可以免费使用该脚本,但请记住,重新发布代码须遵守我们的网站规则。
免责声明
这些信息和出版物并非旨在提供,也不构成TradingView提供或认可的任何形式的财务、投资、交易或其他类型的建议或推荐。请阅读使用条款了解更多信息。