PROTECTED SOURCE SCRIPT
已更新 Directional filter
The idea is to show simply through colors "stronger or weaker" the relevance of candles in the current direction of the asset.
the indicator was made to be used in the graphics of 5m and 15m. based on the SMA20 already indicated previously and with a SMA20 of the graph of 60m.
candles will have their colors modified according to their relevance in the current trend, "A" through "D", where "A" is the strongest and "D" is the weakest.
Conditions:
Buy candle A: price closes above SMA20 (5m or 15m) and above SM20 of 60m.
Buy candle B: price closes above the SMA20 (5m or 15m) and below the SMA20 of 60m.
Buy candle C: Price closes below the SMA20 (5m or 15m) and above the SMA20 60m.
Buy candle D: price closes below the SMA20 (5m or 15m) and below the SMA20 of 60m.
Sell candle A: price closes below the SMA20 (5m or 15m) and below the SMA20 of 60m.
Sell candle B: price closes below the SMA20 (5m or 15m) and above the SMA20 of 60m.
Sell candle C: price closes above the SMA20 (5m or 15m) and below the SMA20 of 60m.
Sell candle D: price closes above the SMA20 (5m or 15m) and above the SMA20 of 60m.
Note 1: SMA8 and SMA200 are also inserted (but they do not interfere with the indicator)
Note 2:
I will leave an image with the colors that represent the relevance of each candle.
https://imageshack.com/a/img921/1808/uv3Wo8.png
版本注释
the update is available to change the color of the SMA 20 (5min or 15min) according to the direction and the asset is.Green = SMA20 UP
Red = SMA20 DOWN
White = NEUTRAL
版本注释
Version 3.0 did the exchange of SMA 8 by EMA 9when the EMA 9 is up your color will be blue, when it is down your color will be orange.
There was no change in the colors of the candles
版本注释
Replacement of SMA 20 by EMA 21.版本注释
All SMA 20 were replaced by EMA 21版本注释
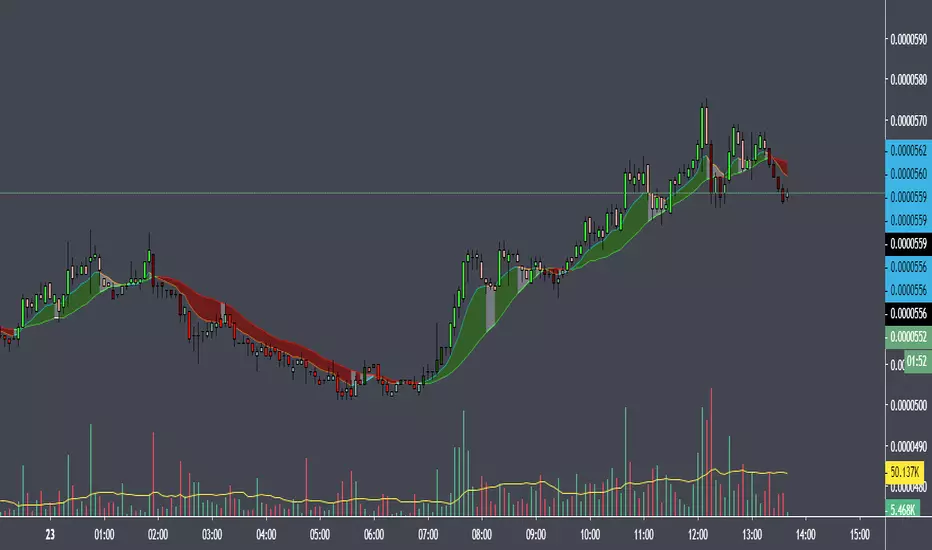
Update to fill the zone between the EMAs selected according to the current price of the asset.price closed above EMAs = green fill
price closed below the EMAs = red fill
price closed between EMAs = white fill
版本注释
fill correction版本注释
I found it more appropriate to exchange EMA 20 for SMA 21.版本注释
a small correction in the names of the settings受保护脚本
此脚本以闭源形式发布。 但是,您可以自由使用,没有任何限制 — 了解更多信息这里。
免责声明
这些信息和出版物并非旨在提供,也不构成TradingView提供或认可的任何形式的财务、投资、交易或其他类型的建议或推荐。请阅读使用条款了解更多信息。
免责声明
这些信息和出版物并非旨在提供,也不构成TradingView提供或认可的任何形式的财务、投资、交易或其他类型的建议或推荐。请阅读使用条款了解更多信息。