OPEN-SOURCE SCRIPT
已更新 Stationary Extrapolated Levels Oscillator
Introduction
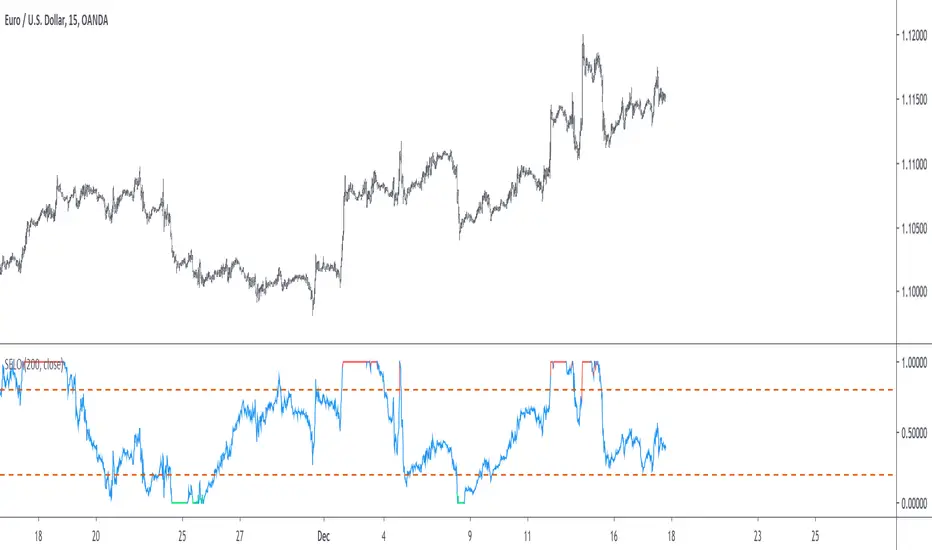
The oscillator version of the stationary extrapolated levels indicator. The methodology behind the extrapolated levels where to minimize the risk of making a decision based only on a forecast, therefore the indicator plotted levels in order to determine possible reversal points, signals where generated when the detrended series crossed over/under those levels.
The Indicator
First we detrend the price, this is because forecasting the trend is often harder than a series without trend (stationarity > non-stationarity), then we forecast the detrended price with a linear extrapolation over a period of length and apply a max/min filter twice to the forecast, the max/min filters are just the highest and lowest function in pine. So the max/min filter have lag length/2, by applying it two times we have a lag of length which is the period of the forecast. Because we use highest and lowest we can apply min-max normalization in the form of :
x' = (x - min(x, min'))/(max(x,max') - min(x, min'))
where x is the detrended price, max' the highest of the forecast of x and min' the lowest of the forecast of x. This result in a scaled oscillator in a range of (1,0),
When the indicator is equal to 1 or 0 there are high chances of reversals, more in depth this mean that the detrended price have crossed the highest/lowest of the forecast, when the indicator is equal to 0 or 1 for a long time this mean that the forecast was quite inaccurate, you can minimize risk by focusing on the cross between the detrended price and the 0.8/0.2 levels.
Conclusion
I've shown an oscillator version of my previous "Stationary extrapolated levels" indicator, the method involving taking the highest and lowest of the forecast is a great way to minimize the risk involved by time-series forecasting driven decisions. So i hope you find an use to it.
Thanks for reading !
版本注释
- v4- additional changes
开源脚本
秉承TradingView的精神,该脚本的作者将其开源,以便交易者可以查看和验证其功能。向作者致敬!您可以免费使用该脚本,但请记住,重新发布代码须遵守我们的网站规则。
Check out the indicators we are making at luxalgo: tradingview.com/u/LuxAlgo/
"My heart is so loud that I can't hear the fireworks"
"My heart is so loud that I can't hear the fireworks"
免责声明
这些信息和出版物并非旨在提供,也不构成TradingView提供或认可的任何形式的财务、投资、交易或其他类型的建议或推荐。请阅读使用条款了解更多信息。