OPEN-SOURCE SCRIPT
已更新 RSI Pie
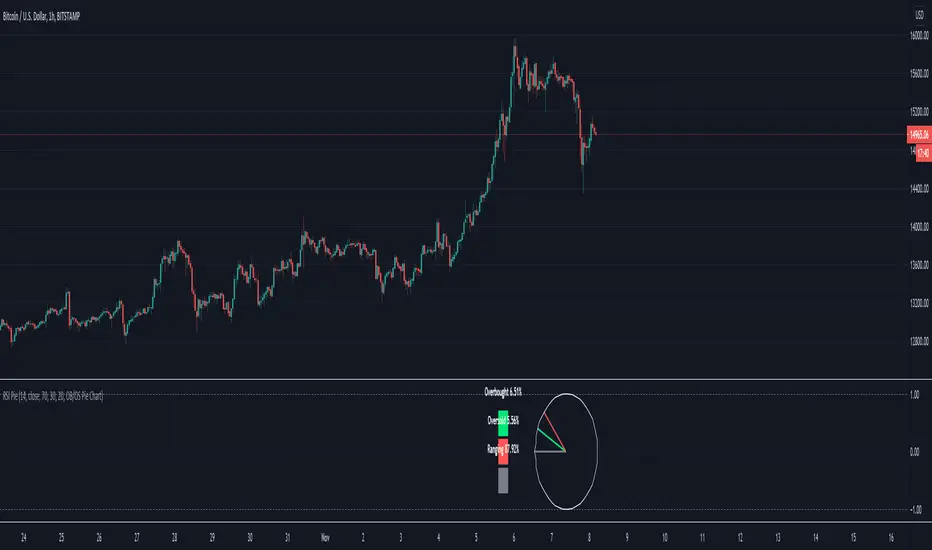
More a novelty than anything useful. Measures the % of overbought/sold RSI and renders as a pie chart. RSI % -> Radians -> (x,y) -> bar_time. 24hr market charts only.
版本注释
Defunct. See : [url=https://www.tradingview.com/script/pHlXdeXI-Pie-Chart-Toolbox/]Pie Chart Toolbox版本注释
See script Pie Chart Toolbox 
开源脚本
秉承TradingView的精神,该脚本的作者将其开源,以便交易者可以查看和验证其功能。向作者致敬!您可以免费使用该脚本,但请记住,重新发布代码须遵守我们的网站规则。
免责声明
这些信息和出版物并非旨在提供,也不构成TradingView提供或认可的任何形式的财务、投资、交易或其他类型的建议或推荐。请阅读使用条款了解更多信息。
开源脚本
秉承TradingView的精神,该脚本的作者将其开源,以便交易者可以查看和验证其功能。向作者致敬!您可以免费使用该脚本,但请记住,重新发布代码须遵守我们的网站规则。
免责声明
这些信息和出版物并非旨在提供,也不构成TradingView提供或认可的任何形式的财务、投资、交易或其他类型的建议或推荐。请阅读使用条款了解更多信息。