PROTECTED SOURCE SCRIPT
Execution Volume Index – ThorenFX | Trinity Traders
Execution Volume Index (EVI) – ThorenFX | Trinity Traders
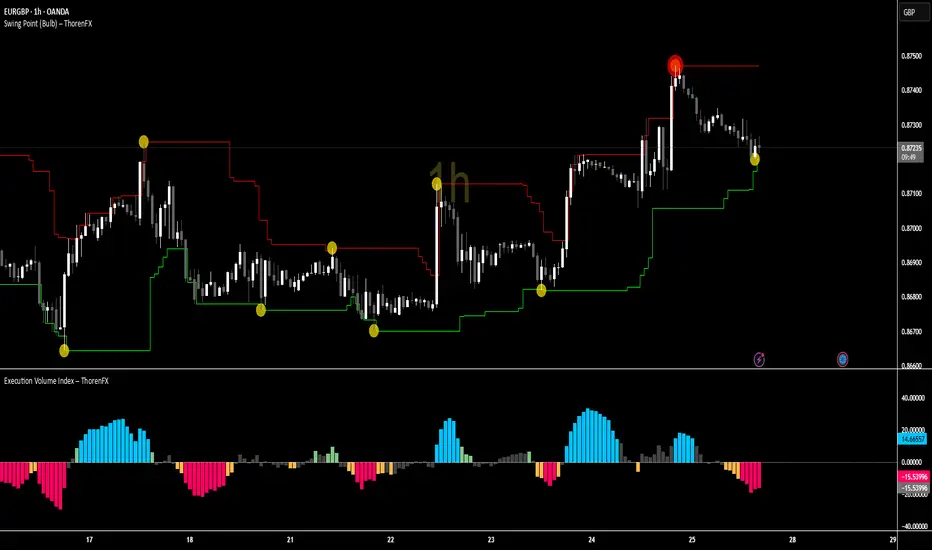
The Execution Volume Index (EVI) by ThorenFX Labs measures real market execution activity — revealing how many buy and sell orders are actually being executed, not just how price moves.
It helps traders identify true participation, showing when the market is quiet and when real money (smart money) is active.
🔍 Core Logic:
When gray bars appear → the market is quiet or accumulating, showing low public interest.
When colored histograms appear → real execution volume is active (either buy or sell aggression).
The indicator uses dual QQE-based logic and volume compression to detect market participation strength.
🎨 Color Interpretation:
Color Meaning Signal Type
🔵 #00c3ff Strong Buy Execution – institutional or high-volume buy aggression Strong Buy
🟢 #81c784 Mild/Aggressive Buy – moderate or early buy participation Moderate Buy
🔴 #ff0062 Strong Sell Execution – institutional or heavy sell orders Strong Sell
🟠 #ffb74d Mild/Aggressive Sell – moderate or early sell participation Moderate Sell
⚪ #707070 Quiet Market Zone – low public participation / accumulation Neutral
💡 Trading Idea:
Best setups often form when the market shows low participation (gray zone) — where the crowd is quiet and volatility is low.
Entry during quiet periods allows you to position before strong execution activity (colored bursts) confirms the trend.
⚙️ Indicator Type:
Volume & Execution Activity Visualizer
Based on Dual QQE Logic + Bollinger Compression
💰 Access & Licensing:
✅ Free to Use for All Traders
Code remains private but can be freely applied on any chart.
🧠 Note:
No indicator is 100% accurate — it’s all about understanding the logic behind the signals.
Developed & Published by:
ThorenFX Labs by Trinity Traders
📧 Contact: shubhampk1000@gmail.com
© 2025 ThorenFX Labs | All Rights Reserved
受保护脚本
此脚本以闭源形式发布。 但是,您可以自由使用它,没有任何限制 — 在此处了解更多信息。
免责声明
这些信息和出版物并不意味着也不构成TradingView提供或认可的金融、投资、交易或其它类型的建议或背书。请在使用条款阅读更多信息。
受保护脚本
此脚本以闭源形式发布。 但是,您可以自由使用它,没有任何限制 — 在此处了解更多信息。
免责声明
这些信息和出版物并不意味着也不构成TradingView提供或认可的金融、投资、交易或其它类型的建议或背书。请在使用条款阅读更多信息。