INVITE-ONLY SCRIPT
已更新 Market Hack
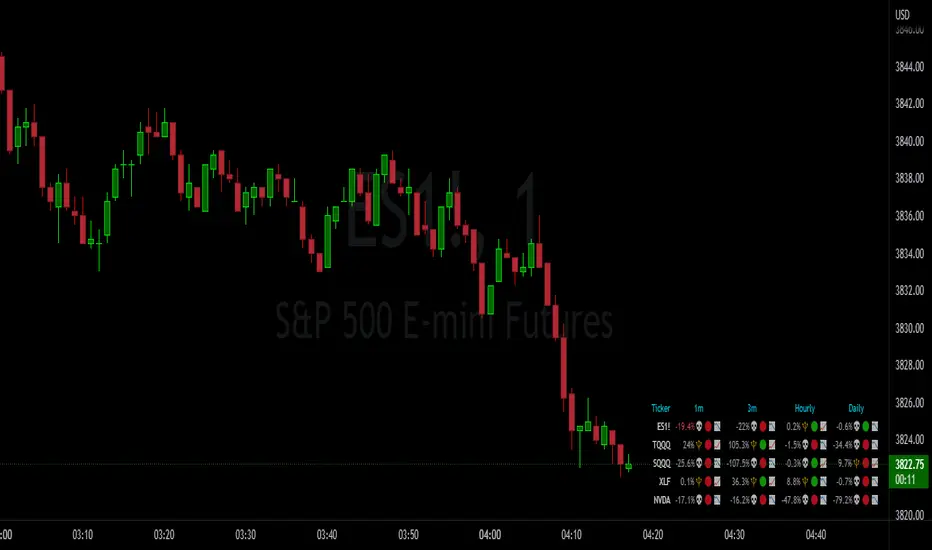
This indicator is intended to only be used in any timeframe between the 1 minute and the 15 minute. If greater than 15 minute, or less than 1 minute, then the table will disappear!
Furthermore, this is a very simple table containing 4 varying emojis:
🔱- This is a gold crossing, indicative of bullish momentum.
💀 - This is a death crossing, indicative of bearish momentum.
🟩 - This represents a bullish cycle, which reinforces the currently active bullish momentum.
🟥 - This represents a bearish cycle, which supports an active bearish momentum.
In summary, 🔱🟩 is perfect confirmation for CALL entry, but even better when at minimum the 1m and 3m care confirmed. Similarly, 💀🟥 confirms an upcoming entry for a PUT. Bear in mind, this indicator is not meant for any financial advice and is only meant to present market direction, or at least a few specific tickers' direction with the market.
版本注释
V3: In this latest update, the EMA is quantified, including exactly when crossings come to occur. Current EMA rates used are:
9/50 for 1m and 3m
9/33 for the 5m
and 7/33 on the 15m.
These values are bound to change in future updates, as fine tuning is performed!
版本注释
V3: Big update ahead!!- Tooltip reminder for ema values to use for back testing ✅
- Against trend / Ending gap silver text logic included now to know when the trend has stopped for each individual timeframe per ticker ✅
- Added options to adjust text color for each aspect, including for bullish/bearish momentum in the EMAs ✅
- Adjusted a function for retrieving the tickers slightly faster ✅
版本注释
V4: In this update...- Boring green/red square emojis were replaced for circular ones! To help keep relevancy to the cycles they represent!
- Option to hide the header for a cleaner experience; added tooltips to each cell to remind the meaning of all values!
- Full indicator title is Market Hack, not MH! hehe.
- Ticker UVXY is replaced with SQQQ as a relevant direct inverse to SPY.
版本注释
V5: Added an additional row at the bottom to make room for the newly introduced indicator by yours truly! Market Maker's Move! Make sure to check that one out! It's mobile-friendly :)版本注释
V6: In this exciting new release:- A fourth ticker is finally introduced!! By default, this is BTCUSD, but can be edited to anything you want!
- Performance has been considerably improved! Now loads almost instantly when swapping between tickers!
- Adjusted the ema ratios for the 15m, which is now 9/33 instead of 7/33. 1m and 3m are still 9/50
- Removed the 5m column to introduce the 1hr (or 60m) column! This one comes at a nearly perfect cyclical ratio of 7/9 for the ema!
- Considerable cleanup to the code to help with display performance!!!
REMINDER: Keep the 1 minute chart on display for maximum accurate results. The 15m chart is the max timeframe for the indicator to display.
The any timeframe above 15 minutes (such as the 30m, 1hr, 4hr, etc) still will not display the indicator to prevent inaccurate results from displaying!!!!!
版本注释
V7: Minor adjustment to enable the 1 hour column visibility anywhere between 1 min. and 60 min. This should allow you to always look at 4 other tickers, if desired!版本注释
V9: In this update.....!- Massive code cleanup for better performance!!!
- Introduced text size adjustment for better experience on either mobile or website! Default is set to mobile!
- Added a fifth ticker option! By default it is NVDA! and BTCUSD was replaced with XLF as a default!
- Introduced the chart up/down emoji to show whether the ticker is above the respective timeframe's 200 ema line!!
Cheers!!!
仅限邀请脚本
只有作者授权的用户才能访问此脚本。您需要申请并获得使用许可。通常情况下,付款后即可获得许可。更多详情,请按照下方作者的说明操作,或直接联系JuanLagos94。
TradingView不建议您付费购买或使用任何脚本,除非您完全信任其作者并了解其工作原理。您也可以在我们的社区脚本找到免费的开源替代方案。
作者的说明
You must message me on discord for access to this particular indicator. Check out the discord group here:
https://discord.gg/AaxDQTHSxQ
免责声明
这些信息和出版物并非旨在提供,也不构成TradingView提供或认可的任何形式的财务、投资、交易或其他类型的建议或推荐。请阅读使用条款了解更多信息。