OPEN-SOURCE SCRIPT
Distribution_Accumulation_ChurningDay_StockUnderStress
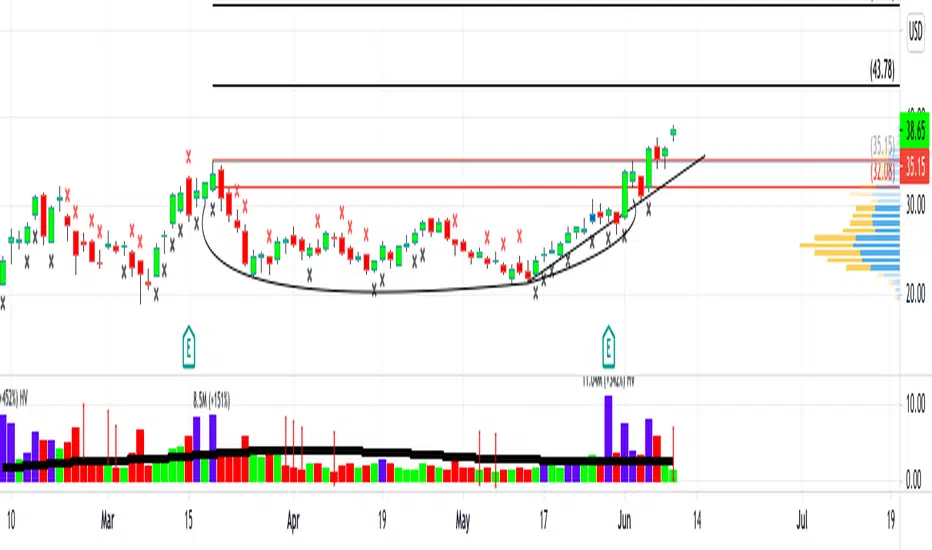
Distribution days is a term related to distribution stock in the sense that heavy institutional selling of shares is taking place. A distribution day, technically speaking, occurs when major market indexes fall 0.2% or more on volume that is higher than the previous trading day.
A follow-through day occurs during a market correction when a major index closes 1% or higher than the previous day, and in greater volume.
Churning day occurs when there is little price progress despite strong volume. It indicates a stock under stress.
You can use the script below in TradingView to plot these on the chart
RED CROSS on top of the bar - High volume Red (Distribution)
Black CROSS on bottom of bar - High Volume Green day (Accumulation/ Follow through)
Blue Bar with Black Cross. - High Volume green day but closed 55% below the day days range. (Churning action)
Blue Bar - Stock had a green day but closed in lower bounds(55% below the day days range) i.e under stress
开源脚本
秉承TradingView的精神,该脚本的作者将其开源,以便交易者可以查看和验证其功能。向作者致敬!您可以免费使用该脚本,但请记住,重新发布代码须遵守我们的网站规则。
免责声明
这些信息和出版物并非旨在提供,也不构成TradingView提供或认可的任何形式的财务、投资、交易或其他类型的建议或推荐。请阅读使用条款了解更多信息。
开源脚本
秉承TradingView的精神,该脚本的作者将其开源,以便交易者可以查看和验证其功能。向作者致敬!您可以免费使用该脚本,但请记住,重新发布代码须遵守我们的网站规则。
免责声明
这些信息和出版物并非旨在提供,也不构成TradingView提供或认可的任何形式的财务、投资、交易或其他类型的建议或推荐。请阅读使用条款了解更多信息。