OPEN-SOURCE SCRIPT
VIX:VIX3M Ratio
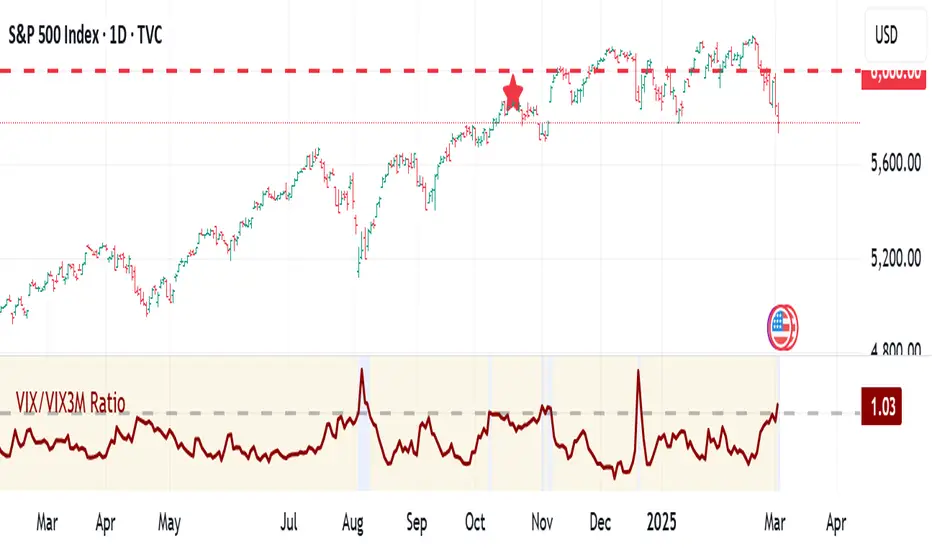
The VIX/VIX3M Ratio indicator compares the short-term (1-month) volatility index (VIX) to the medium-term (3-month) volatility index (VIX3M). This ratio provides insights into the market's volatility expectations across different time horizons.
Key Interpretations:
Potential Trading Insights:
Key Interpretations:
- Ratio > 1: Short-term volatility expectations are higher than 3-month expectations
- Ratio = 1: Short-term and medium-term volatility expectations are aligned
- Ratio < 1: Medium-term volatility expectations are higher than short-term expectations
Potential Trading Insights:
- A rising ratio may indicate increasing near-term market uncertainty
- Significant deviations from 1.0 can signal potential market stress or changing risk perceptions
- Traders use this to gauge the term structure of market volatility
开源脚本
秉承TradingView的精神,该脚本的作者将其开源,以便交易者可以查看和验证其功能。向作者致敬!您可以免费使用该脚本,但请记住,重新发布代码须遵守我们的网站规则。
免责声明
这些信息和出版物并非旨在提供,也不构成TradingView提供或认可的任何形式的财务、投资、交易或其他类型的建议或推荐。请阅读使用条款了解更多信息。
免责声明
这些信息和出版物并非旨在提供,也不构成TradingView提供或认可的任何形式的财务、投资、交易或其他类型的建议或推荐。请阅读使用条款了解更多信息。