PROTECTED SOURCE SCRIPT
已更新 EPS & Sales/Revenue Growth Marker
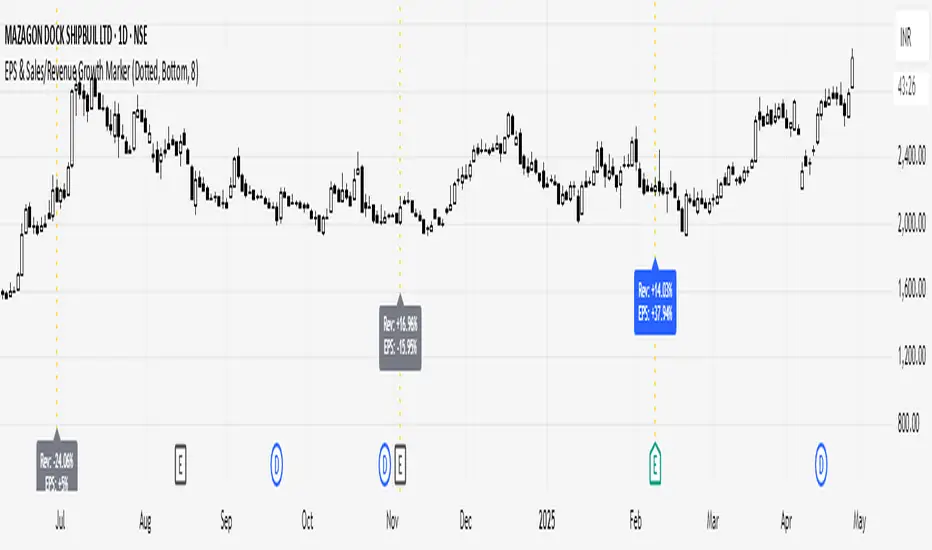
This script plots the Revenue Growth and EPS Growth % on Earnings Date.
Idea Credit: Special thanks to dharmeshrbhatt for inspiring the concept behind this tool.
Developed and Published by learningvitals.
Idea Credit: Special thanks to dharmeshrbhatt for inspiring the concept behind this tool.
Developed and Published by learningvitals.
- Plots Revenue Growth % and EPS Growth % on earnings date.
- Choose label position: Above Bar, Below Bar, Top, or Bottom.
- Customizable growth colors based on combined EPS and Revenue performance.
- Customizable line style and colors.
- Controls max number of labels to keep the chart clean.
版本注释
- Added + sign display for positive Revenue Growth % and EPS Growth % values.
- No change to core functionality or layout.
版本注释
Improved Detection of Earnings EventsIn this update, the script has been enhanced to detect earnings events more reliably.
Earlier, it mainly relied on official earnings data. Now, even if official earnings data is unavailable for a stock, the script can still detect earnings events using changes in financial figures like Revenue and EPS.
This ensures that the growth markers (vertical lines and labels) continue to appear consistently without missing important events, even for stocks with incomplete data.
As a result, you get better visibility of Revenue and EPS growth trends across a wider range of stocks!
受保护脚本
此脚本以闭源形式发布。 但是,您可以自由使用它,没有任何限制 — 在此处了解更多信息。
免责声明
这些信息和出版物并不意味着也不构成TradingView提供或认可的金融、投资、交易或其它类型的建议或背书。请在使用条款阅读更多信息。
受保护脚本
此脚本以闭源形式发布。 但是,您可以自由使用它,没有任何限制 — 在此处了解更多信息。
免责声明
这些信息和出版物并不意味着也不构成TradingView提供或认可的金融、投资、交易或其它类型的建议或背书。请在使用条款阅读更多信息。