OPEN-SOURCE SCRIPT
Buying and Selling Volume Pressure S/R
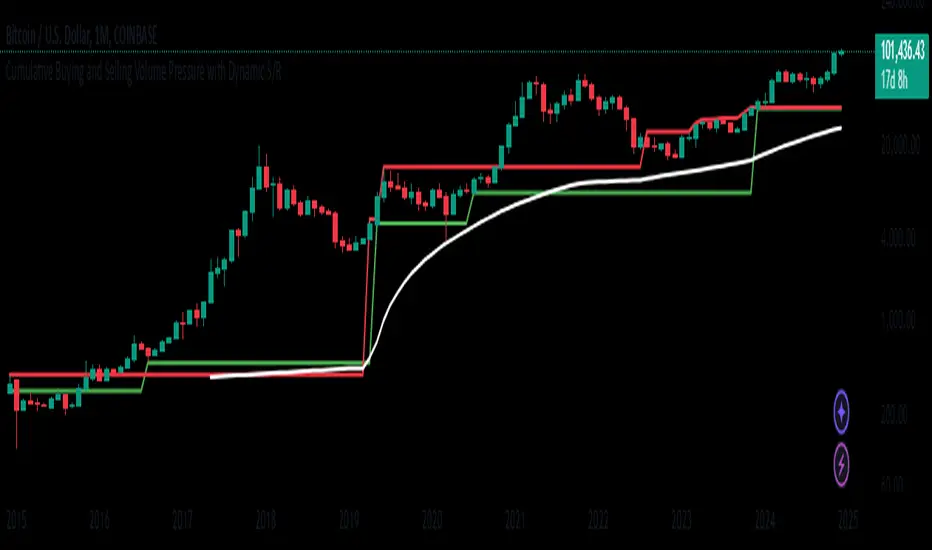
This custom indicator aims to visualize underlying market pressure by cumulatively analyzing where trade volume occurs relative to each candle's price range. By separating total volume into "buying" (when price closes near the high of the bar) and "selling" (when price closes near the low of the bar), the indicator identifies shifts in dominance between buyers and sellers over a defined lookback period.
When cumulative buying volume surpasses cumulative selling volume (a "bullish cross"), it suggests that buyers are gaining control. Conversely, when cumulative selling volume exceeds cumulative buying volume (a "bearish cross"), it indicates that sellers are taking the upper hand.
Based on these crossovers, the indicator derives dynamic Support and Resistance lines. After a bullish cross, it continuously tracks and updates the lowest low that occurs while the trend is bullish, forming a support zone. Similarly, after a bearish cross, it updates the highest high that appears during the bearish trend, forming a resistance zone.
A Mid Line is then calculated as the average of the current dynamic support and resistance levels, providing a central reference point. Around this Mid Line, the script constructs an upper and lower channel based on standard deviation, offering a sense of volatility or "divergence" from the mean level.
Finally, the indicator provides simple buy and sell signals: a buy signal is triggered when the price closes back above the Mid Line, suggesting a potential shift toward bullish conditions, while a sell signal appears when the price closes below the Mid Line, hinting at a possible bearish move.
In summary, this indicator blends volume-based market pressure analysis with adaptive support and resistance detection and overlays them onto the chart. It helps traders quickly gauge who controls the market (buyers or sellers), identify dynamic levels of support and resistance, and receive alerts on potential trend changes—simplifying decision-making in rapidly evolving market conditions.
Important Notice:
Trading financial markets involves significant risk and may not be suitable for all investors. The use of technical indicators like this one does not guarantee profitable results. This indicator should not be used as a standalone analysis tool. It is essential to combine it with other forms of analysis, such as fundamental analysis, risk management strategies, and awareness of current market conditions. Always conduct thorough research or consult with a qualified financial advisor before making trading decisions. Past performance is not indicative of future results.
Disclaimer:
Trading financial instruments involves substantial risk and may not be suitable for all investors. Past performance is not indicative of future results. This indicator is provided for informational and educational purposes only and should not be considered investment advice. Always conduct your own research and consult with a licensed financial professional before making any trading decisions.
Note: The effectiveness of any technical indicator can vary based on market conditions and individual trading styles. It's crucial to test indicators thoroughly using historical data and possibly paper trading before applying them in live trading scenarios.
开源脚本
秉承TradingView的精神,该脚本的作者将其开源,以便交易者可以查看和验证其功能。向作者致敬!您可以免费使用该脚本,但请记住,重新发布代码须遵守我们的网站规则。
免责声明
这些信息和出版物并非旨在提供,也不构成TradingView提供或认可的任何形式的财务、投资、交易或其他类型的建议或推荐。请阅读使用条款了解更多信息。
开源脚本
秉承TradingView的精神,该脚本的作者将其开源,以便交易者可以查看和验证其功能。向作者致敬!您可以免费使用该脚本,但请记住,重新发布代码须遵守我们的网站规则。
免责声明
这些信息和出版物并非旨在提供,也不构成TradingView提供或认可的任何形式的财务、投资、交易或其他类型的建议或推荐。请阅读使用条款了解更多信息。