INVITE-ONLY SCRIPT
BollingerBandsLine
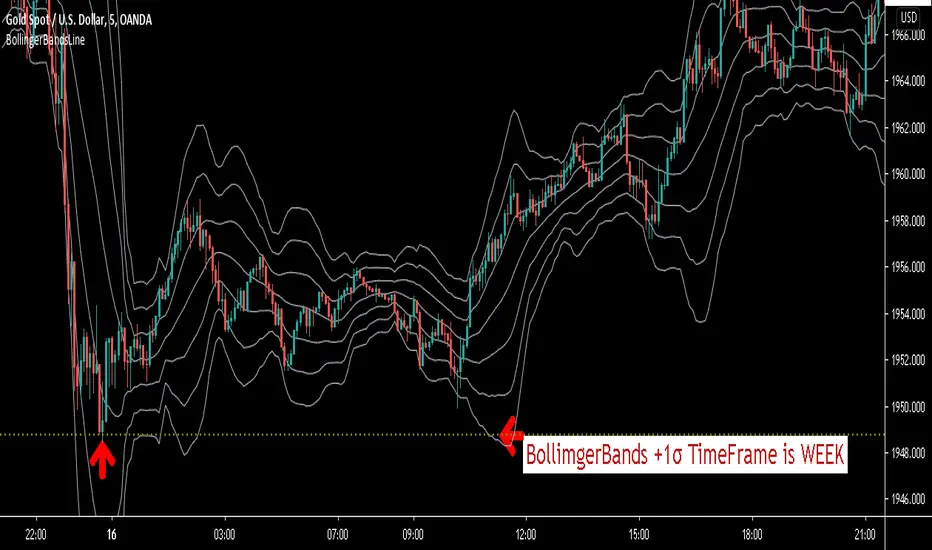
This script will display the price of Bollinger Bands .
For example.See the image above.
You can grasp the price of + 1σ on the weekly chart while looking at the five-minute chart.
You can know the existence of resistance.And you can get the sign of reversal.
This script can display the price of Bollinger Bands for each hour at the same time.
M5,M15,M30,H1,H4,DAY,WEEK,MONTH.
You can also display the price of the middle line for the specified period.
All lines can be changed in color.
You can also specify three Bollinger Bands deviations.
± 1σ is very important in Bollinger Bands .
Once the price goes out of ± 1σ, it may become a trend and start a bandwalk.
Conversely, if the price returns to within ± 1σ, the trend may reverse.
With a line drawn there, this script will help you trade.
If you are interested in the invitation-only indicator, please contact us on private chat.
The following is an explanation in Japanese.
通常のボリンジャーバンドのミドルラインと+1σ、-1σに加えて、
指定した2つの偏差のラインを表示できます。
※デフォルト設定ではミドルラインと±1σ、±2σ、±3σになっています。
5分足・15分足・30分足・1時間足・4時間足・日足・週足・月足のボリンジャーバンドの±1σ、及びミドルラインにリアルタイムで自動的にラインを引いてくれるインジケーターです。
好きな時間足のチャートを見ながら今、各時間足のボリンジャーバンド±1σ、及びミドルラインがどの位置にあるか把握することができます。
各時間足の±1σ、ミドルそれぞれラインの色を変更可能!
必要のない時間足の±1σ及びミドルラインのON・OFFが変更可能!
自分の見やすいようにお好みでアレンジできます!
TradingViewの設定で「インジケーター名ラベル」をオンにすれば、
この水平線がどの時間足のどこの水平線なのか説明が表示されます!
このインジケーターに興味がある方はプライベートチャットで連絡ください。
免责声明
这些信息和出版物并非旨在提供,也不构成TradingView提供或认可的任何形式的财务、投资、交易或其他类型的建议或推荐。请阅读使用条款了解更多信息。