PROTECTED SOURCE SCRIPT
已更新 Market Breadth Ratio [Pt]
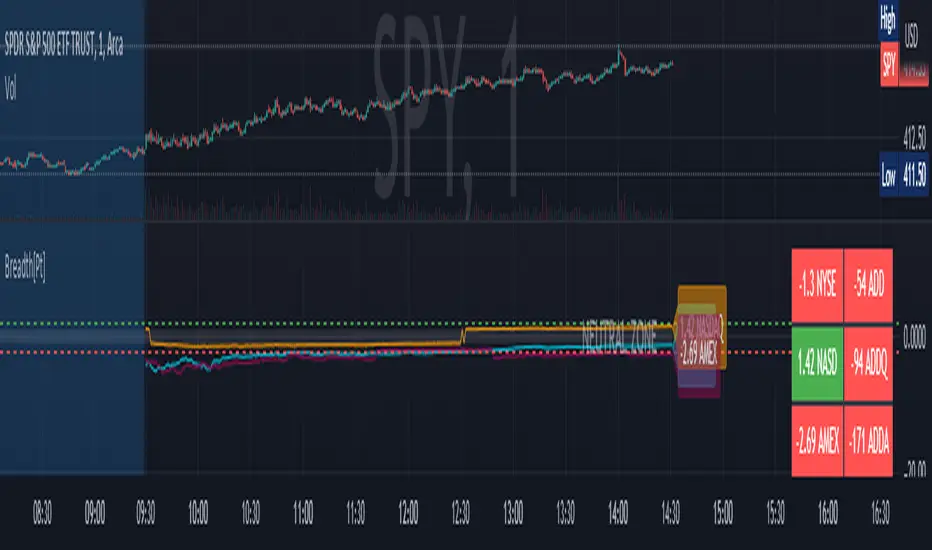
The Market Breadth Indicator is a technical analysis tool that provides traders and investors with valuable insights into the overall health of the stock market. This particular version of the indicator plots the Up Volume vs Down Volume Ratios for three major U.S. stock exchanges - NYSE, NASDAQ and AMEX - on a single chart.
The Up Volume vs Down Volume Ratios measure the strength of buying versus selling pressure in the market. A ratio greater than 1 indicates that there is more buying pressure, while a ratio less than -1 indicates more selling pressure. The ratio is calculated by dividing the total volume of stocks that closed up on the day by the total volume of stocks that closed down.
By plotting the Up Volume vs Down Volume Ratios for all three exchanges, the Market Breadth Indicator provides a comprehensive view of the overall market sentiment. If all three ratios are above 1, it indicates that the market is in a bullish trend, while if all three ratios are below -1, it indicates a bearish trend. A divergence between the ratios can also signal potential shifts in market sentiment.
Traders can use the Market Breadth Indicator to confirm the direction of the market and identify potential buying or selling opportunities. For example, if the market is in a bullish trend and the NYSE ratio is consistently higher than the other two ratios, it may indicate that the NYSE is leading the market and traders may want to focus on buying stocks listed on the NYSE.
Overall, the Market Breadth Indicator is a valuable tool for traders and investors to assess the overall market health and make informed trading decisions based on market sentiment.
Bonus feature: there is an option to display data for ADD for the three exchanges as well on the data table.
版本注释
Updated to fixed timezone issue for futures版本注释
Added toggle option for data table版本注释
Updated toggles for data table related to each market.版本注释
fixed minor bug on label受保护脚本
此脚本以闭源形式发布。 但是,您可以自由使用,没有任何限制 — 了解更多信息这里。
Purchases / Subscriptions / Support - buymeacoffee.com/ptgambler
PayPal - paypal.me/PtGambler
You can reach me privately through my Discord Channel: discord.gg/WMQfaVGyQC
PayPal - paypal.me/PtGambler
You can reach me privately through my Discord Channel: discord.gg/WMQfaVGyQC
免责声明
这些信息和出版物并非旨在提供,也不构成TradingView提供或认可的任何形式的财务、投资、交易或其他类型的建议或推荐。请阅读使用条款了解更多信息。
受保护脚本
此脚本以闭源形式发布。 但是,您可以自由使用,没有任何限制 — 了解更多信息这里。
Purchases / Subscriptions / Support - buymeacoffee.com/ptgambler
PayPal - paypal.me/PtGambler
You can reach me privately through my Discord Channel: discord.gg/WMQfaVGyQC
PayPal - paypal.me/PtGambler
You can reach me privately through my Discord Channel: discord.gg/WMQfaVGyQC
免责声明
这些信息和出版物并非旨在提供,也不构成TradingView提供或认可的任何形式的财务、投资、交易或其他类型的建议或推荐。请阅读使用条款了解更多信息。