OPEN-SOURCE SCRIPT
Overnight High/Low
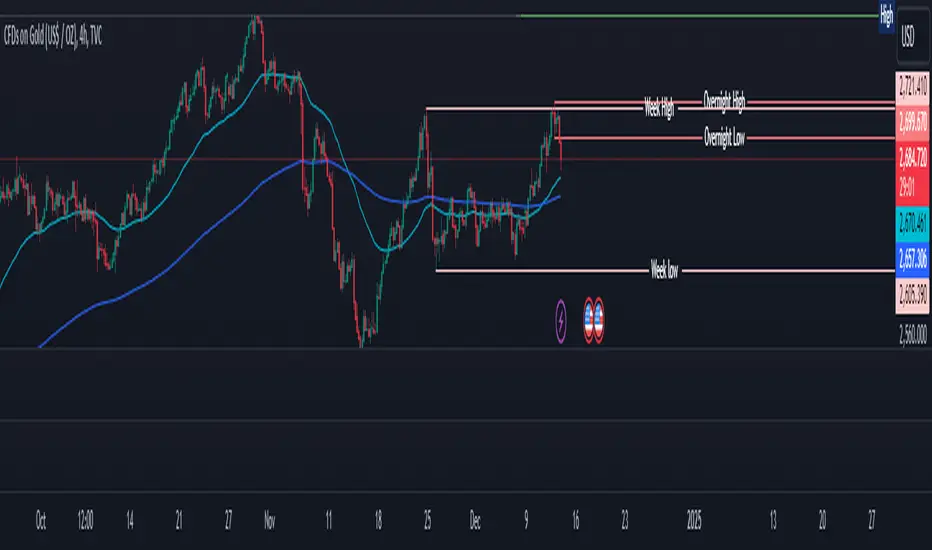
The script identifies the Overnight High (the highest price) and Overnight Low (the lowest price) for a trading instrument during a specified overnight session. It then plots these levels on the chart for reference in subsequent trading sessions.
Key Features:
Time Settings:
The script defines the start (startHour) and end (endHour + endMinute) times for the overnight session.
The session spans across two calendar days, such as 5:00 PM (17:00) to 9:30 AM (09:30).
Tracking High and Low:
During the overnight session, the script dynamically tracks:
Overnight High: The highest price reached during the session.
Overnight Low: The lowest price reached during the session.
Reset Mechanism:
After the overnight session ends (at the specified end time), the script resets the overnightHigh and overnightLow variables, preparing for the next session.
Visual Representation:
The script uses horizontal dotted lines to plot:
A green line for the Overnight High.
A red line for the Overnight Low.
These lines extend to the right of the chart, providing visual reference points for traders.
How It Works:
Session Detection:
The script checks whether the current time falls within the overnight session:
If the hour is greater than or equal to the start hour (e.g., 17:00).
Or if the hour is less than or equal to the end hour (e.g., 09:30), considering the next day.
The end minute (e.g., 30 minutes past the hour) is also considered for precision.
High and Low Calculation:
During the overnight session:
If the overnightHigh is not yet defined, it initializes with the current candle's high.
If already defined, it updates by comparing the current candle's high to the existing overnightHigh using the math.max function.
Similarly, overnightLow is initialized or updated using the math.min function.
Post-Session Reset:
After the session ends, the script clears the overnightHigh and overnightLow variables by setting them to na (not available).
Line Drawing:
The script draws horizontal dotted lines for the Overnight High and Low during and after the session.
The lines extend indefinitely to the right of the chart.
Benefits:
Visual Aid: Helps traders quickly identify overnight support and resistance levels, which are critical for intraday trading.
Automation: Removes the need for manually plotting these levels each day.
Customizable: Time settings can be adjusted to match different markets or trading strategies.
This script is ideal for traders who use the overnight range as part of their analysis for breakouts, reversals, or trend continuation strategies.
开源脚本
秉承TradingView的精神,该脚本的作者将其开源,以便交易者可以查看和验证其功能。向作者致敬!您可以免费使用该脚本,但请记住,重新发布代码须遵守我们的网站规则。
免责声明
这些信息和出版物并非旨在提供,也不构成TradingView提供或认可的任何形式的财务、投资、交易或其他类型的建议或推荐。请阅读使用条款了解更多信息。
开源脚本
秉承TradingView的精神,该脚本的作者将其开源,以便交易者可以查看和验证其功能。向作者致敬!您可以免费使用该脚本,但请记住,重新发布代码须遵守我们的网站规则。
免责声明
这些信息和出版物并非旨在提供,也不构成TradingView提供或认可的任何形式的财务、投资、交易或其他类型的建议或推荐。请阅读使用条款了解更多信息。