PROTECTED SOURCE SCRIPT
已更新 Best Liquidity Indicator v0.6.3
Best Liquidity Indicator (BLI)
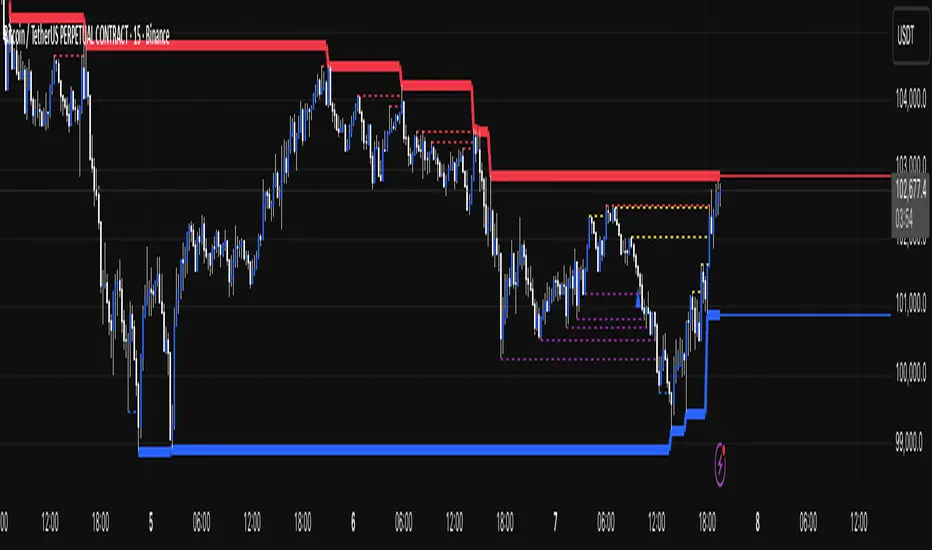
BLI maps where liquidity typically sits—and when it gets taken. It automatically draws:
BLI maps where liquidity typically sits—and when it gets taken. It automatically draws:
- Sell-side liquidity (SSL) levels and Buy-side liquidity (BSL) levels
- Liquidity grabs when price runs a level
- Ex-liquidity (invalidated/older grabs) to show the evolving path of least resistance
- (Optional) Liquidity Rails: continuous, flat “stairs” that follow only active liquidity levels to give you a smooth, higher-level read of the market’s liquidity envelope
- (Optional) the same logic from a higher timeframe (e.g., 4H) overlaid on your current chart
版本注释
- Fixed issues preventing HTF liquidity levels from showing on the chart.
- Made Improvements to the Liquidity rail lines. (Further improvements to come in next version.
受保护脚本
此脚本以闭源形式发布。 但是,您可以自由使用它,没有任何限制 — 在此处了解更多信息。
免责声明
这些信息和出版物并不意味着也不构成TradingView提供或认可的金融、投资、交易或其它类型的建议或背书。请在使用条款阅读更多信息。
受保护脚本
此脚本以闭源形式发布。 但是,您可以自由使用它,没有任何限制 — 在此处了解更多信息。
免责声明
这些信息和出版物并不意味着也不构成TradingView提供或认可的金融、投资、交易或其它类型的建议或背书。请在使用条款阅读更多信息。