OPEN-SOURCE SCRIPT
Rolling Net Volume
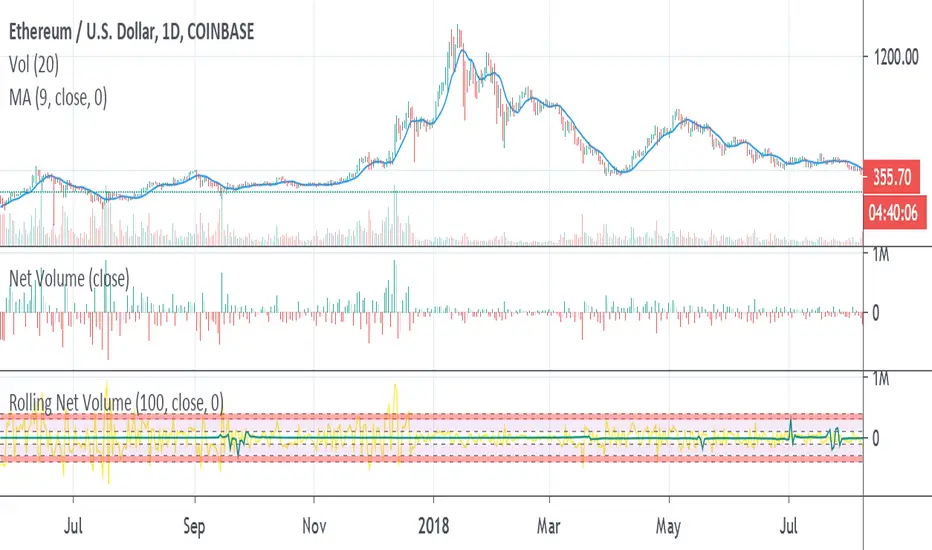
May still make changes, the current study should be helpful as is. Looking to highlight potential relative trend exhaustion in net volume. Should be most effective for stable supply assets. We're looking at an 100 day moving average of net volume essentially. The values of the RNV are slightly exaggerated to help with visibility PLEASE bear this in mind. Never the less, you can look at many commodities and notice moderate and extreme trend exhaustion on the positive and negative side using the transparent bands above and below. The less transparent red band perhaps suggests an opportunity to open a position against the current direction. It's not perfect, I may try to improve it. I am definitely open to feedback and appreciate it very much in advance.
开源脚本
秉承TradingView的精神,该脚本的作者将其开源,以便交易者可以查看和验证其功能。向作者致敬!您可以免费使用该脚本,但请记住,重新发布代码须遵守我们的网站规则。
免责声明
这些信息和出版物并非旨在提供,也不构成TradingView提供或认可的任何形式的财务、投资、交易或其他类型的建议或推荐。请阅读使用条款了解更多信息。
开源脚本
秉承TradingView的精神,该脚本的作者将其开源,以便交易者可以查看和验证其功能。向作者致敬!您可以免费使用该脚本,但请记住,重新发布代码须遵守我们的网站规则。
免责声明
这些信息和出版物并非旨在提供,也不构成TradingView提供或认可的任何形式的财务、投资、交易或其他类型的建议或推荐。请阅读使用条款了解更多信息。