OPEN-SOURCE SCRIPT
Previous Daily Candle
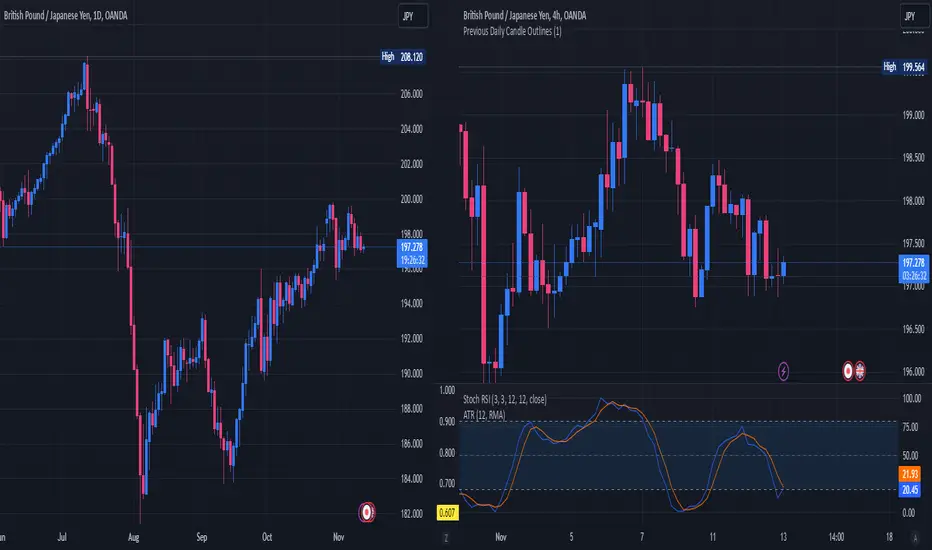
The Previous Daily Candle indicator is a powerful tool designed to enhance your intraday trading by providing clear visual cues of the previous day's price action. By outlining the high, low, open, and close of the previous daily candle and adding a middle dividing line, this indicator offers valuable context to inform your trading decisions.
🎯 Purpose
Visual Clarity: Highlight the key levels from the previous day's price movement directly on your intraday charts.
Trend Confirmation: Quickly identify bullish or bearish sentiment based on the previous day's candle structure.
Support and Resistance: Use the outlined high and low as potential support and resistance levels for your trading strategies.
Customizable Visualization: Tailor the appearance of the outlines and middle line to fit your trading style and chart aesthetics.
🛠️ Features
Outlined Candle Structure:
High and Low Lines: Clearly mark the previous day's high and low with customizable colors and line widths.
Open and Close Representation: Visualize the previous day's open and close through the outlined structure.
Middle Dividing Line:
Average Price Level: A horizontal line divides the candle in half, representing the average of the open and close prices.
Customizable Appearance: Adjust the color and thickness to distinguish it from the high and low outlines.
Bullish and Bearish Differentiation:
Color-Coded Outlines: Automatically change the outline color based on whether the previous day's candle was bullish (green by default) or bearish (red by default).
Enhanced Visual Feedback: Quickly assess market sentiment with intuitive color cues.
Customization Options:
Outline Colors: Choose distinct colors for bullish and bearish candle outlines to match your chart's color scheme.
Middle Line Color: Select a color that stands out or blends seamlessly with your existing chart elements.
Line Width Adjustment: Modify the thickness of all lines to ensure visibility without cluttering the chart.
Transparent Candle Body:
Non-Intrusive Display: The indicator only draws the outlines and middle line, keeping the candle body transparent to maintain the visibility of your primary chart data.
⚙️ How It Works
Data Retrieval: The indicator fetches the previous day's open, high, low, and close prices using TradingView's request.security function.
Candle Analysis: Determines whether the previous day's candle was bullish or bearish by comparing the close and open prices.
Dynamic Drawing: Upon the start of a new day, the indicator deletes the previous outlines and redraws them based on the latest data.
Time Synchronization: Accurately aligns the outlines with the corresponding time periods on your intraday chart.
📈 How to Use
Add to Chart:
Open TradingView and navigate to the Pine Editor.
Paste the provided Pine Script code into the editor.
Click on Add to Chart to apply the indicator.
Customize Settings:
Access the indicator's settings by clicking the gear icon next to its name on the chart.
Adjust the Bullish Outline Color, Bearish Outline Color, Middle Line Color, and Outline Width to your preference.
Interpret the Lines:
Bullish Candle: If the previous day's close is higher than its open, the outlines will display in the bullish color (default green).
Bearish Candle: If the previous day's close is lower than its open, the outlines will display in the bearish color (default red).
Middle Line: Represents the midpoint between the open and close, providing a quick reference for potential support or resistance.
Integrate with Your Strategy:
Use the high and low outlines as potential entry or exit points.
Combine with other indicators for confirmation to strengthen your trading signals.
开源脚本
秉承TradingView的精神,该脚本的作者将其开源,以便交易者可以查看和验证其功能。向作者致敬!您可以免费使用该脚本,但请记住,重新发布代码须遵守我们的网站规则。
免责声明
这些信息和出版物并非旨在提供,也不构成TradingView提供或认可的任何形式的财务、投资、交易或其他类型的建议或推荐。请阅读使用条款了解更多信息。
免责声明
这些信息和出版物并非旨在提供,也不构成TradingView提供或认可的任何形式的财务、投资、交易或其他类型的建议或推荐。请阅读使用条款了解更多信息。