INVITE-ONLY SCRIPT
Trading Loons Algo - V1
Trading Loons Algo
Greetings! Thank you for your interest in our script. We are very pleased with the accuracy of our indicators and are highly confident they will augment your trading strategy.
These indicators are designed to identify momentum for low-float stocks under $20 and signal optimal ‘bullish’ entry and ‘bearish’ exit.
Our indicators span across whichever time interval candle best suits your trading strategy and are intended to be used for both intraday traders (e.g. leveraging 1m, 3m, 5m, etc. candles) as well as multiday traders (leveraging daily candles).
For intraday trading best results, we recommend leveraging 1m candles for high-volume & low-float moving stocks. However, they will work on any stock under evaluation.
For multiday trading best results, we recommend leveraging the daily candles for stocks under $20 and looking for the green uptrend arrow indicating ‘bullish’ momentum. A red downtrend arrow indicates ‘bearish’ momentum.
This script offers a variety of indicators and we will continue to enhance its offerings.
We recommend the following indicator configuration:
Intraday Trading:
- Display Intraday Bullish Momentum Alert
- Display Intraday Volume Crossover
- Display Intraday Full Session High and Low
- Display Volume Weighted Average Price (VWAP)
Multiday Trading:
- Display Daily Regular Session High and Low
- Daily Regular Session High and Low Max Range Value (200)
How to use it for intraday trading:
- Find a low-float stock, preferably under 20 million, that is already up 15%.
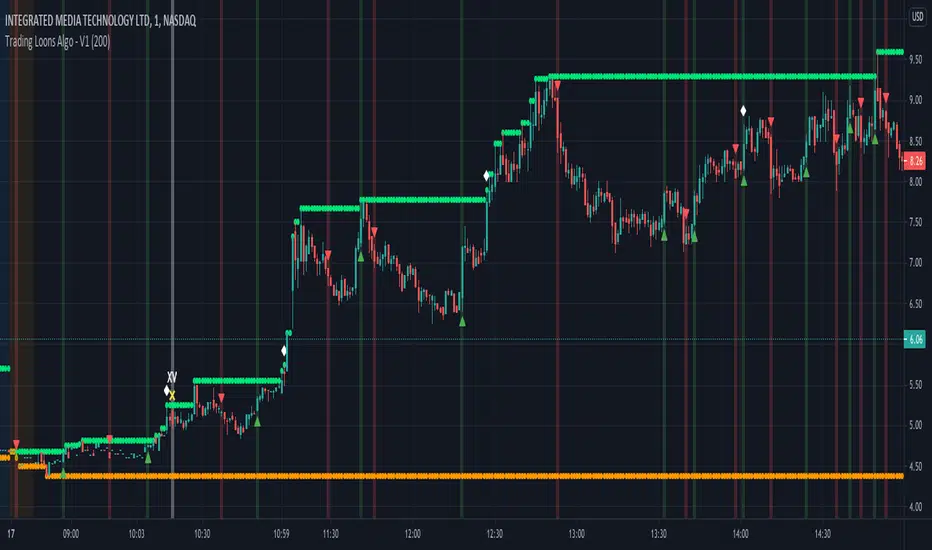
- Load the 1-minute (1m) chart and look for the ‘Display Intraday Bullish Momentum Alert’ indicator which is a white diamond above the bar when the bar closes.
Trading Loons Tip: It’s not necessary, but if you see the ‘XV’ indicator (i.e. from the ‘Display Intraday Volume Crossover’ indicator), you know there is above average volume coming in, which is a bullish sign!
- If the bar with the ‘Display Intraday Bullish Momentum Alert’ indicator reached a new high of the day, wait for a pull-back and allow for the accumulation period. The accumulation period could last a few minutes or tens-of-minutes.
- During the accumulation period, look for a green ‘bullish’ uptrend indicator arrow below the 1-minute bar once the bar closes.
NOTE: We recommend using the 1-minute bar. However, these intraday indicators can be used on whichever bar chart aligns with your trading strategy (e.g. 3m, 5m, etc.)
Please reference these intraday chart examples:


How to use it for multiday trading:
- Find a stock under $20 dollars (the lower the float, the better).
- Load the daily (D) chart and look for a green ‘bullish’ uptrend indicator arrow below the bar once the daily bar closes.
Please reference these multiday chart examples:


You can set up your own alerts to be notified when there is ‘bullish’ multiday momentum (green uptrend triangle below bar), ‘bearish’ multiday momentum (red downtrend triangle above bar) or ‘bullish’ intraday momentum (white diamond above bar).
Please note, you will need to subscribe to market data on TradingView. We suggest subscribing to the following:
- ARCA – ARCA & MKT
- NASDAQ – NASDAQ Stock Market
- NYSE – New York Stock Exchange
Disclaimer: If you are using this script, you acknowledge past performance is not necessarily indicative of future results and no script can 100% guarantee success in trading.
Greetings! Thank you for your interest in our script. We are very pleased with the accuracy of our indicators and are highly confident they will augment your trading strategy.
These indicators are designed to identify momentum for low-float stocks under $20 and signal optimal ‘bullish’ entry and ‘bearish’ exit.
Our indicators span across whichever time interval candle best suits your trading strategy and are intended to be used for both intraday traders (e.g. leveraging 1m, 3m, 5m, etc. candles) as well as multiday traders (leveraging daily candles).
For intraday trading best results, we recommend leveraging 1m candles for high-volume & low-float moving stocks. However, they will work on any stock under evaluation.
For multiday trading best results, we recommend leveraging the daily candles for stocks under $20 and looking for the green uptrend arrow indicating ‘bullish’ momentum. A red downtrend arrow indicates ‘bearish’ momentum.
This script offers a variety of indicators and we will continue to enhance its offerings.
We recommend the following indicator configuration:
Intraday Trading:
- Display Intraday Bullish Momentum Alert
- Display Intraday Volume Crossover
- Display Intraday Full Session High and Low
- Display Volume Weighted Average Price (VWAP)
Multiday Trading:
- Display Daily Regular Session High and Low
- Daily Regular Session High and Low Max Range Value (200)
How to use it for intraday trading:
- Find a low-float stock, preferably under 20 million, that is already up 15%.
- Load the 1-minute (1m) chart and look for the ‘Display Intraday Bullish Momentum Alert’ indicator which is a white diamond above the bar when the bar closes.
Trading Loons Tip: It’s not necessary, but if you see the ‘XV’ indicator (i.e. from the ‘Display Intraday Volume Crossover’ indicator), you know there is above average volume coming in, which is a bullish sign!
- If the bar with the ‘Display Intraday Bullish Momentum Alert’ indicator reached a new high of the day, wait for a pull-back and allow for the accumulation period. The accumulation period could last a few minutes or tens-of-minutes.
- During the accumulation period, look for a green ‘bullish’ uptrend indicator arrow below the 1-minute bar once the bar closes.
NOTE: We recommend using the 1-minute bar. However, these intraday indicators can be used on whichever bar chart aligns with your trading strategy (e.g. 3m, 5m, etc.)
Please reference these intraday chart examples:
How to use it for multiday trading:
- Find a stock under $20 dollars (the lower the float, the better).
- Load the daily (D) chart and look for a green ‘bullish’ uptrend indicator arrow below the bar once the daily bar closes.
Please reference these multiday chart examples:
You can set up your own alerts to be notified when there is ‘bullish’ multiday momentum (green uptrend triangle below bar), ‘bearish’ multiday momentum (red downtrend triangle above bar) or ‘bullish’ intraday momentum (white diamond above bar).
Please note, you will need to subscribe to market data on TradingView. We suggest subscribing to the following:
- ARCA – ARCA & MKT
- NASDAQ – NASDAQ Stock Market
- NYSE – New York Stock Exchange
Disclaimer: If you are using this script, you acknowledge past performance is not necessarily indicative of future results and no script can 100% guarantee success in trading.
仅限邀请脚本
只有作者授权的用户才能访问此脚本。您需要申请并获得使用许可。通常情况下,付款后即可获得许可。更多详情,请按照下方作者的说明操作,或直接联系TradingLoons。
TradingView不建议您付费购买或使用任何脚本,除非您完全信任其作者并了解其工作原理。您也可以在我们的社区脚本找到免费的开源替代方案。
作者的说明
This is a premium, invite-only script. Please send us a private message to receive access or visit http://www.tradingloons.com to learn more.
We at Trading Loons are: Crazy About Trading!
Learn more about the products we offer at: tradingloons.com
Follow us on Twitter: @tradingloons
Learn more about the products we offer at: tradingloons.com
Follow us on Twitter: @tradingloons
免责声明
这些信息和出版物并非旨在提供,也不构成TradingView提供或认可的任何形式的财务、投资、交易或其他类型的建议或推荐。请阅读使用条款了解更多信息。