OPEN-SOURCE SCRIPT
Math by Thomas Swing Range

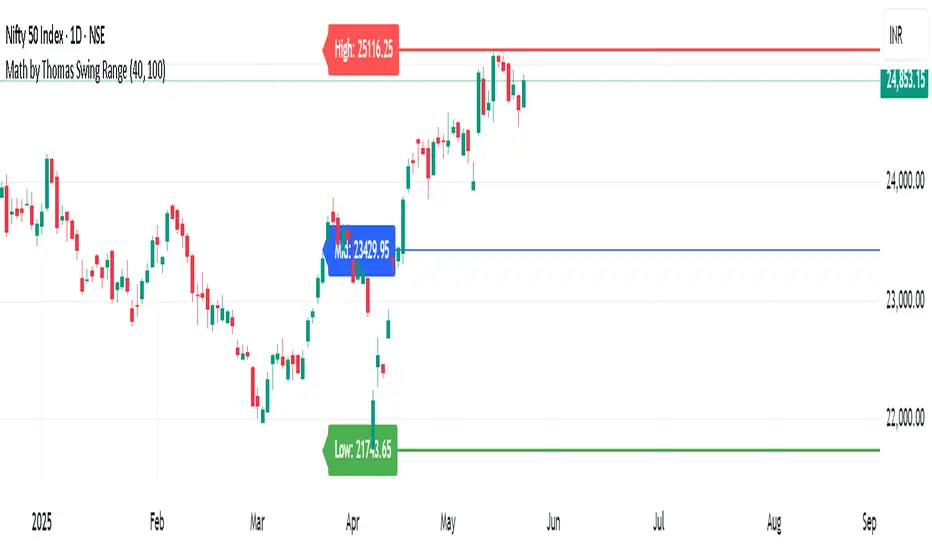
Math by Thomas Swing Range is a simple yet powerful tool designed to visually highlight key swing levels in the market based on a user-defined lookback period. It identifies the highest high, lowest low, and calculates the midpoint between them — creating a clear range for swing trading strategies.
These levels can help traders:
Spot potential support and resistance zones
Analyze price rejection near range boundaries
Frame mean-reversion or breakout setups
The indicator continuously updates and extends these lines into the future, making it easier to plan and manage trades with visual clarity.
🛠️ How to Use
Add to Chart:
Apply the indicator on any timeframe and asset (works best on higher timeframes like 1H, 4H, or Daily).
Configure Parameters:
Lookback Period: Number of candles used to detect the highest high and lowest low. Default is 20.
Extend Lines by N Bars: Number of future bars the levels should be projected to the right.
Interpret Lines:
🔴 Red Line: Swing High (Resistance)
🟢 Green Line: Swing Low (Support)
🔵 Blue Line: Midpoint (Mean level — useful for equilibrium-based strategies)
Trade Ideas:
Bounce trades from swing high/low zones.
Breakout confirmation if price closes strongly outside the range.
Reversion trades if price moves toward the midpoint after extreme moves.
开源脚本
秉承TradingView的精神,该脚本的作者将其开源,以便交易者可以查看和验证其功能。向作者致敬!您可以免费使用该脚本,但请记住,重新发布代码须遵守我们的网站规则。
免责声明
这些信息和出版物并非旨在提供,也不构成TradingView提供或认可的任何形式的财务、投资、交易或其他类型的建议或推荐。请阅读使用条款了解更多信息。
开源脚本
秉承TradingView的精神,该脚本的作者将其开源,以便交易者可以查看和验证其功能。向作者致敬!您可以免费使用该脚本,但请记住,重新发布代码须遵守我们的网站规则。
免责声明
这些信息和出版物并非旨在提供,也不构成TradingView提供或认可的任何形式的财务、投资、交易或其他类型的建议或推荐。请阅读使用条款了解更多信息。