OPEN-SOURCE SCRIPT
已更新 Sembang Kari Traders - EMA & Wave Stacked Labels + EMA 34 Lines
This script is 2 in 1 indicator.
1. Multi Timeframe EMA Labels
- This label indicator shows labels for EMA stacked up or EMA stacked down or EMA in sideway trend.
- EMA used in this script is EMA 8, EMA 21, EMA 34 and EMA 55.
- If the EMA 8 line is above EMA 21 line, and EMA 21 line is above EMA 34 line, and EMA 34 line is above EMA 55 line ( EMA STACKED UP) = the trend is BULLISH and the label will colored to GREEN on that timeframe.
- If the EMA 8 line is below EMA 21 line, and EMA 21 line is below EMA 34 line, and EMA 34 line is below EMA 55 line ( EMA STACKED DOWN) = the trend is BEARISH and the label will colored to RED on that timeframe.
- If either 1 of the EMA 8, or EMA 21, or EMA 34, or EMA 55 is NOT STACKED = the trend is SIDEWAY and the label will colored to YELLOW on that timeframe.
- Timeframe shows in label is Daily, 4 hours, 1 hour, 15 minutes and 5 minutes.
- This indicator labels will be useful to identifying trend in others timeframe without to look or open that other timeframe. Example, if u in 5 minutes timeframe chart, then u see that "D" is colored to GREEN, then straight will know that EMA 8, EMA 21, EMA 34 and EMA 55 is STACKED UP which means BULLISH without to look or open that Daily timeframe .
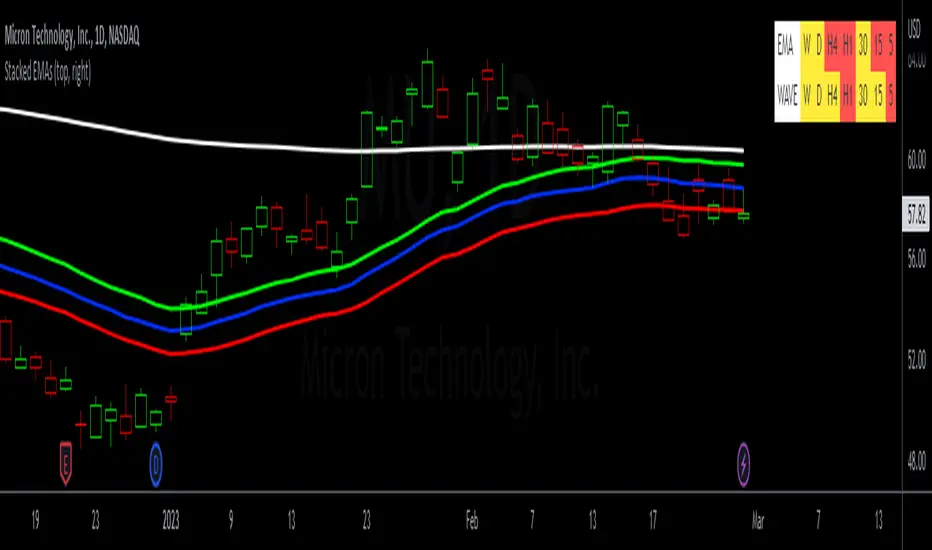
2. EMA 34 Lines
- This is indicator shows 3 exponential moving average line which is EMA 34 lines.
- This indicator will shows 3 lines which is GREEN, BLUE, and RED.
- The GREEN line is EMA 34 HIGH
- The BLUE line is EMA 34 CLOSE
- The RED line is EMA 34 BLUE
Trade Idea
- The idea using this indicator is we want to take an entry setup when the candle pull back to EMA 34 lines and at the same time using the EMA labels to be confirmation as label will indicates trends in multiple timeframe.
- When price moved far away from EMA 34 lines, then wait till price pullback to EMA lines and confirmed it by trend labels provided to take take a entry setup.
- this indicator can be used on all tickers
1. Multi Timeframe EMA Labels
- This label indicator shows labels for EMA stacked up or EMA stacked down or EMA in sideway trend.
- EMA used in this script is EMA 8, EMA 21, EMA 34 and EMA 55.
- If the EMA 8 line is above EMA 21 line, and EMA 21 line is above EMA 34 line, and EMA 34 line is above EMA 55 line ( EMA STACKED UP) = the trend is BULLISH and the label will colored to GREEN on that timeframe.
- If the EMA 8 line is below EMA 21 line, and EMA 21 line is below EMA 34 line, and EMA 34 line is below EMA 55 line ( EMA STACKED DOWN) = the trend is BEARISH and the label will colored to RED on that timeframe.
- If either 1 of the EMA 8, or EMA 21, or EMA 34, or EMA 55 is NOT STACKED = the trend is SIDEWAY and the label will colored to YELLOW on that timeframe.
- Timeframe shows in label is Daily, 4 hours, 1 hour, 15 minutes and 5 minutes.
- This indicator labels will be useful to identifying trend in others timeframe without to look or open that other timeframe. Example, if u in 5 minutes timeframe chart, then u see that "D" is colored to GREEN, then straight will know that EMA 8, EMA 21, EMA 34 and EMA 55 is STACKED UP which means BULLISH without to look or open that Daily timeframe .
2. EMA 34 Lines
- This is indicator shows 3 exponential moving average line which is EMA 34 lines.
- This indicator will shows 3 lines which is GREEN, BLUE, and RED.
- The GREEN line is EMA 34 HIGH
- The BLUE line is EMA 34 CLOSE
- The RED line is EMA 34 BLUE
Trade Idea
- The idea using this indicator is we want to take an entry setup when the candle pull back to EMA 34 lines and at the same time using the EMA labels to be confirmation as label will indicates trends in multiple timeframe.
- When price moved far away from EMA 34 lines, then wait till price pullback to EMA lines and confirmed it by trend labels provided to take take a entry setup.
- this indicator can be used on all tickers
版本注释
Updated version, added time frame weekly and also added EMA200 line for reference.开源脚本
秉承TradingView的精神,该脚本的作者将其开源,以便交易者可以查看和验证其功能。向作者致敬!您可以免费使用该脚本,但请记住,重新发布代码须遵守我们的网站规则。
免责声明
这些信息和出版物并非旨在提供,也不构成TradingView提供或认可的任何形式的财务、投资、交易或其他类型的建议或推荐。请阅读使用条款了解更多信息。
开源脚本
秉承TradingView的精神,该脚本的作者将其开源,以便交易者可以查看和验证其功能。向作者致敬!您可以免费使用该脚本,但请记住,重新发布代码须遵守我们的网站规则。
免责声明
这些信息和出版物并非旨在提供,也不构成TradingView提供或认可的任何形式的财务、投资、交易或其他类型的建议或推荐。请阅读使用条款了解更多信息。