OPEN-SOURCE SCRIPT
2band
Hello traders
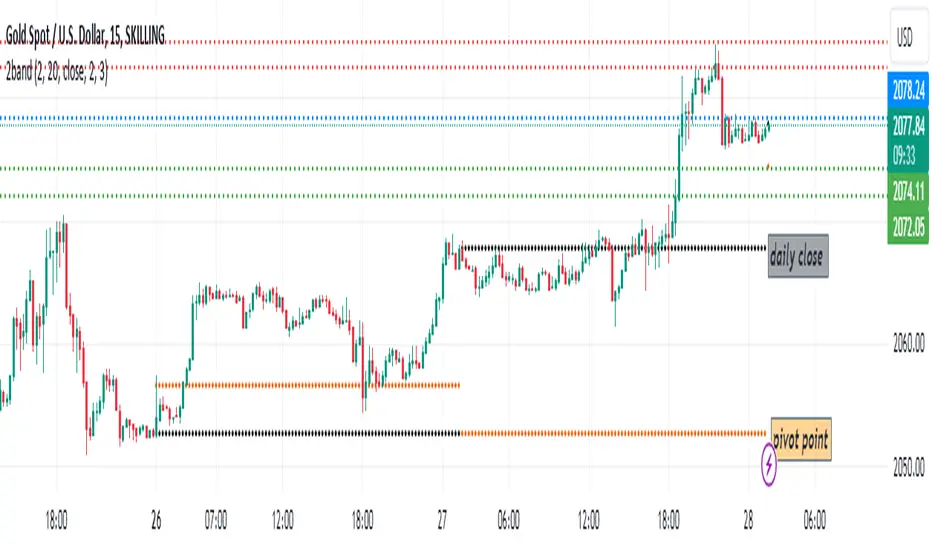
In this script, I have defined two bands with a deviation of 2 and 3
I designed the setup so that the upper lines represent red resistance, the lower lines represent green support, and the blue line represents the average price of the previous 20 candles in each time frame.
This code can be used mostly in time frames above 30 minutes and somehow predict possible price targets.
For example, if the price closes above the blue line in the one-hour time frame, the two fixed lines above are considered as targets and vice versa.
I have also added the pivot point calculation formula in orange
Most importantly, I added the closing price of the previous days in black
I hope it will be used by dear traders and you will support more for new works.
开源脚本
秉承TradingView的精神,该脚本的作者将其开源,以便交易者可以查看和验证其功能。向作者致敬!您可以免费使用该脚本,但请记住,重新发布代码须遵守我们的网站规则。
免责声明
这些信息和出版物并非旨在提供,也不构成TradingView提供或认可的任何形式的财务、投资、交易或其他类型的建议或推荐。请阅读使用条款了解更多信息。
开源脚本
秉承TradingView的精神,该脚本的作者将其开源,以便交易者可以查看和验证其功能。向作者致敬!您可以免费使用该脚本,但请记住,重新发布代码须遵守我们的网站规则。
免责声明
这些信息和出版物并非旨在提供,也不构成TradingView提供或认可的任何形式的财务、投资、交易或其他类型的建议或推荐。请阅读使用条款了解更多信息。