OPEN-SOURCE SCRIPT
已更新 ATR Mark Up/Down
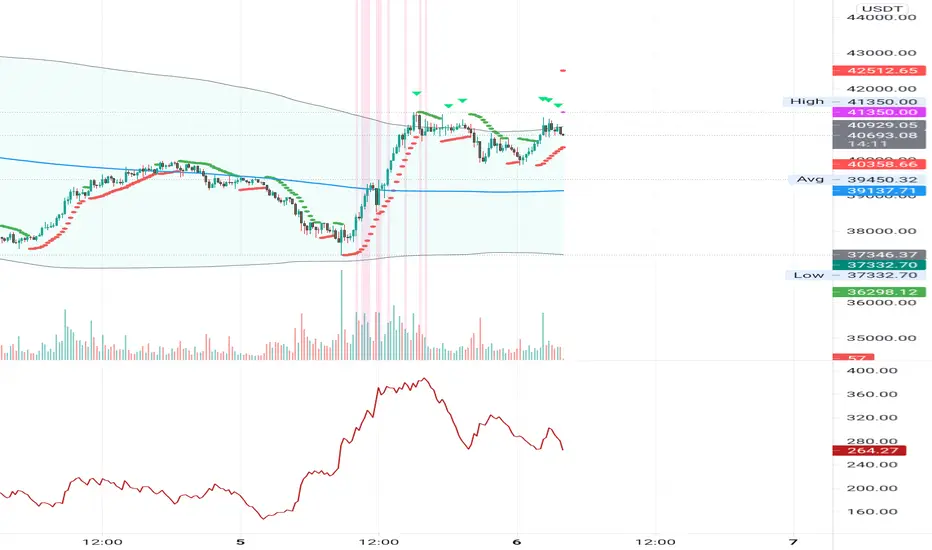
This script looks for a period with increased volatility, as measured by ATR (Average True Range), then it looks for a high or a low in that area.
When price is above EMA (200 is default, can be changed), it looks for the highs and adds multiples of ATR to the high. Default values for multipliers are 3,9 and 27, meaning that the script will show 3xATR level above the high, 9xATR above the high and 27xATR above the high.
When price is below EMA it looks for the lows and subtracts multiples of ATR from the low.The script will show 3xATR level below the low, 9xATR below the low and 27xATR below the low.
Multipliers values can be changed as well, making it a versatile tool that shows potential levels of suppport/resistance based on the volatility.
Possible use cases:
Breakout trading, when price crosses a certain level, it may show potential profit targets for trades opened at a breakout.
Stoploss helper. Many traders use ATR for their stoplosses, 1 ATR below the swing low for long trades and 1 ATR above the swing high for short trades are common values used by many traders. In this case, the Lookback value comes handy, if we want to look maybe at a more recent value for swing high/low point.
The levels shown by this indicator are not guaranteed to be or not to be reached by price, these levels should be used in confluence with other indicators and looked at as a visual helper.
That's all, hope you enjoy it!
PS.
*It does not plot the ATR. I don't know how to do it and IF it can be done
** It does not plot the EMA. If necessary,it can be added in a future update
版本注释
* select moving average type (EMA or SMA)* plot moving average
* Bollinger Bands on moving average
* highlight highs/lows at BB breaks
* filter peaks by volume (may not work as expected, use with caution, disabled by default)
* highlight ATR peaks areas
* Parabolic SAR added to better identify trend changes
开源脚本
秉承TradingView的精神,该脚本的作者将其开源,以便交易者可以查看和验证其功能。向作者致敬!您可以免费使用该脚本,但请记住,重新发布代码须遵守我们的网站规则。
免责声明
这些信息和出版物并非旨在提供,也不构成TradingView提供或认可的任何形式的财务、投资、交易或其他类型的建议或推荐。请阅读使用条款了解更多信息。
免责声明
这些信息和出版物并非旨在提供,也不构成TradingView提供或认可的任何形式的财务、投资、交易或其他类型的建议或推荐。请阅读使用条款了解更多信息。