OPEN-SOURCE SCRIPT
Different Donchian Periods
Hi!
This is a very simple script that I couldn't find on TradingView yet. Look at this indicator how you want (band, cloud, ma's) and create your own settings, I did not test it.
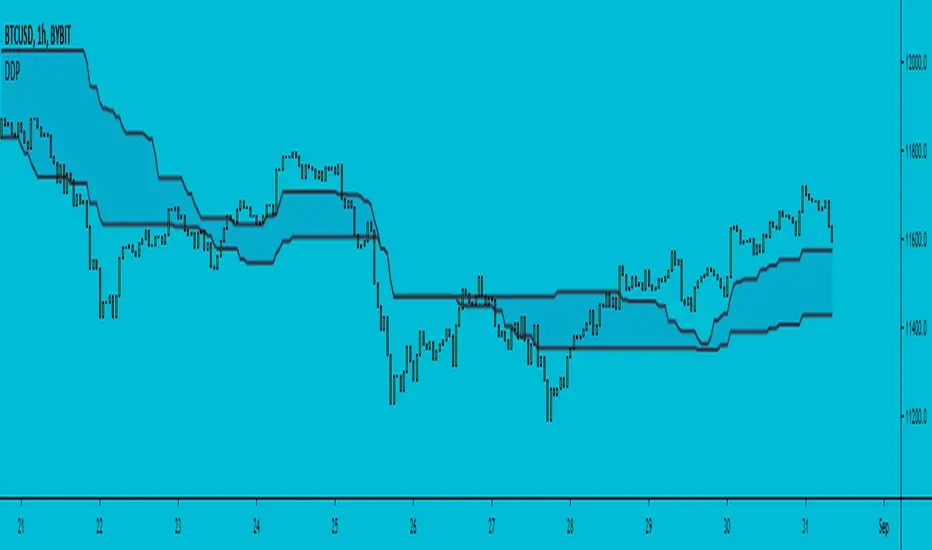
Normally, Donchian average calculates the average(middle) of the highest point of a given period and the lowest point of that same period.
Here I use two separate periods, one for highest, a different one for lowest. That's it :)
Let me know if it's useful to you, I appreciate your comments.
This is a very simple script that I couldn't find on TradingView yet. Look at this indicator how you want (band, cloud, ma's) and create your own settings, I did not test it.
Normally, Donchian average calculates the average(middle) of the highest point of a given period and the lowest point of that same period.
Here I use two separate periods, one for highest, a different one for lowest. That's it :)
Let me know if it's useful to you, I appreciate your comments.
开源脚本
秉承TradingView的精神,该脚本的作者将其开源,以便交易者可以查看和验证其功能。向作者致敬!您可以免费使用该脚本,但请记住,重新发布代码须遵守我们的网站规则。
免责声明
这些信息和出版物并非旨在提供,也不构成TradingView提供或认可的任何形式的财务、投资、交易或其他类型的建议或推荐。请阅读使用条款了解更多信息。
免责声明
这些信息和出版物并非旨在提供,也不构成TradingView提供或认可的任何形式的财务、投资、交易或其他类型的建议或推荐。请阅读使用条款了解更多信息。