OPEN-SOURCE SCRIPT
Trading the Trend
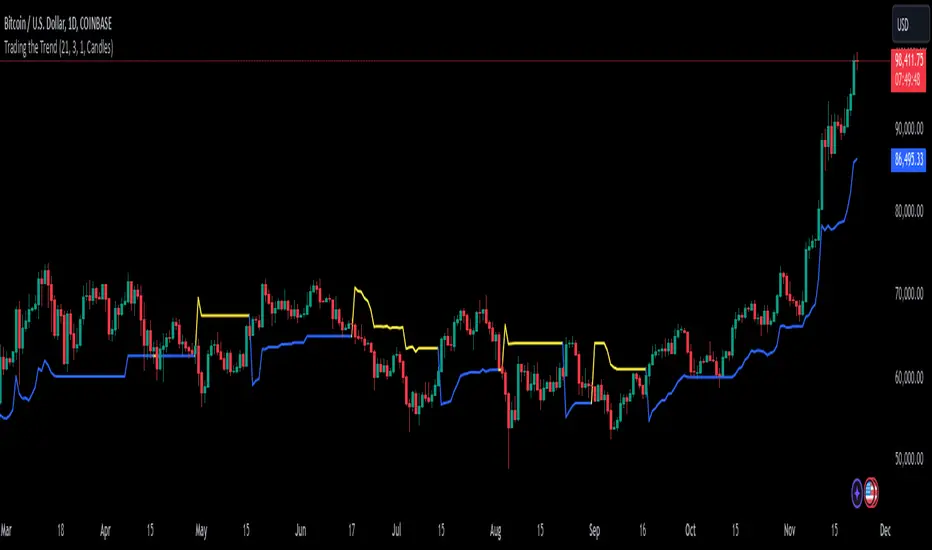
Trading the Trend Indicator by Andrew Abraham (TASC, 1998)
The Trading the Trend indicator, developed by Andrew Abraham, combines volatility and trend-following principles to identify market direction. It uses a 21-period weighted average of the True Range (ATR) to measure volatility and define uptrends and downtrends.
Calculation: The True Range (highest high minus lowest low) is smoothed using a 21-period weighted moving average. This forms the basis for the trend filter, setting dynamic thresholds for trend identification.
Uptrend: Higher highs are confirmed when price stays above the upper threshold, signaling long opportunities.
Downtrend: Lower lows are identified when price stays below the lower threshold, favoring short positions.
This system emphasizes trading only in the direction of the prevailing trend, filtering out market noise and focusing on sustained price movements.
The trendline changes her color. When there is an uptrend the trendline is blue and when the trend is downward the trendline is yellow.
开源脚本
秉承TradingView的精神,该脚本的作者将其开源,以便交易者可以查看和验证其功能。向作者致敬!您可以免费使用该脚本,但请记住,重新发布代码须遵守我们的网站规则。
免责声明
这些信息和出版物并非旨在提供,也不构成TradingView提供或认可的任何形式的财务、投资、交易或其他类型的建议或推荐。请阅读使用条款了解更多信息。
免责声明
这些信息和出版物并非旨在提供,也不构成TradingView提供或认可的任何形式的财务、投资、交易或其他类型的建议或推荐。请阅读使用条款了解更多信息。