INVITE-ONLY SCRIPT
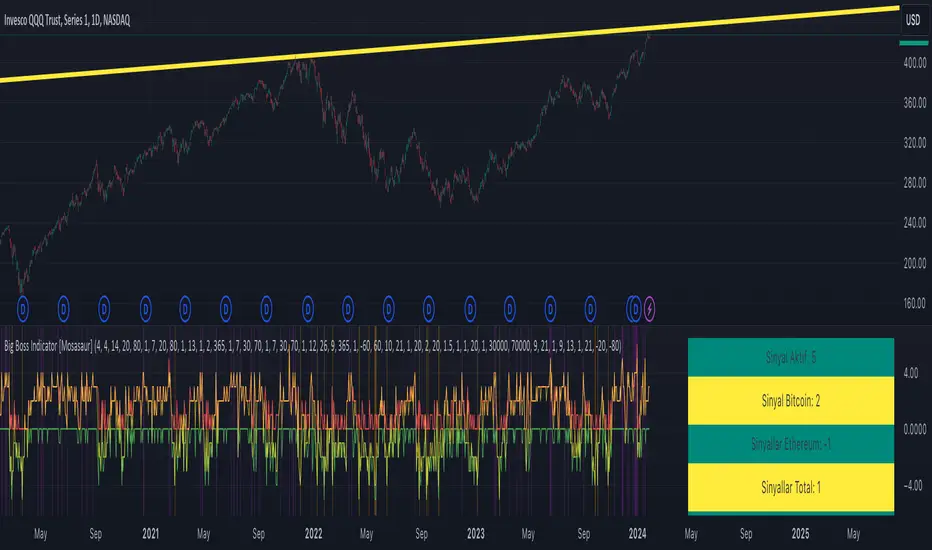
已更新 Megalodon Pro Advance Data Calculator

It is designed to combine price, volume and indicator data from different brokers/exchanges. This helps us to have a more accurate data, so that we can have a better picture of the price/volume/indicators.
Features
Usage
* Just select the data points you would like to combine in the setting to view price, volume or indicators data.
Settings
I hope you will find some VALUE $
~Bo
Enlightening the modern investors
Features
- It may combine up to 18 different data sources.
- It can print indicators such as MFI, RSI, OBV, BB, Williams%R. If you have any suggestions, write them in the comment section below.
Usage
* Just select the data points you would like to combine in the setting to view price, volume or indicators data.
Settings
- Setting 1 defines the source you would like to use to view Only Price information.
- Setting 2 defines the indicator you would like to print. OnlyPrice is the default setting which views the source information defined.
- Setting 3 defines the length for RSI.
- Setting 4 defines the length for MFI.
- Setting 5 defines the length for Bollinger Band(BB).
- Setting 6 defines the Bollinger Bands' standard deviation.
- Setting 7 defines the length for Williams%R.
I hope you will find some VALUE $
~Bo
Enlightening the modern investors
版本注释
Big Boss Indicator updated...仅限邀请脚本
只有作者授权的用户才能访问此脚本。您需要申请并获得使用许可。通常情况下,付款后即可获得许可。更多详情,请按照下方作者的说明操作,或直接联系MegalodonTrading。
TradingView不建议您付费购买或使用任何脚本,除非您完全信任其作者并了解其工作原理。您也可以在我们的社区脚本找到免费的开源替代方案。
作者的说明
Telegram Here t.me/bugrasukas
免责声明
这些信息和出版物并非旨在提供,也不构成TradingView提供或认可的任何形式的财务、投资、交易或其他类型的建议或推荐。请阅读使用条款了解更多信息。
仅限邀请脚本
只有作者授权的用户才能访问此脚本。您需要申请并获得使用许可。通常情况下,付款后即可获得许可。更多详情,请按照下方作者的说明操作,或直接联系MegalodonTrading。
TradingView不建议您付费购买或使用任何脚本,除非您完全信任其作者并了解其工作原理。您也可以在我们的社区脚本找到免费的开源替代方案。
作者的说明
Telegram Here t.me/bugrasukas
免责声明
这些信息和出版物并非旨在提供,也不构成TradingView提供或认可的任何形式的财务、投资、交易或其他类型的建议或推荐。请阅读使用条款了解更多信息。