OPEN-SOURCE SCRIPT
Quick-Glance RSI
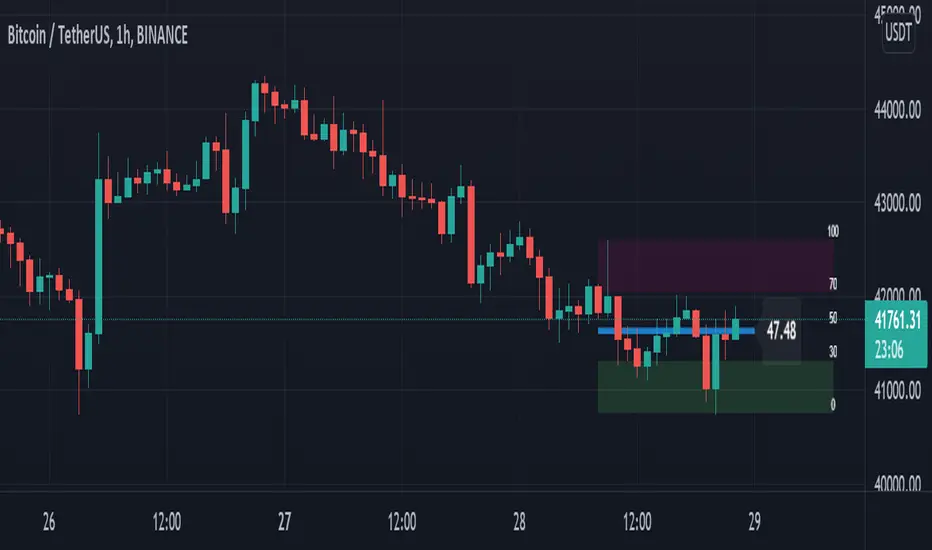
This script will draw a live, updating-RSI on the main chart. As the price updates, the RSI line will self-adjust between the highest high an the lowest low for the RSI period.
Settings/Customizations:
RSI Length: Calculate RSI and draw RSI Line for specified period
Overbought Level: Draw maroon box from OB level to highest high.
Oversold Level: Draw green box from lowest low to OS level.
Scale Offset: Fine-tune location of 0-100 scale.
Show Scale: Draw 0-100 levels to the right of the RSI line.
Show RSI Line: Draw a line from the start of the RSI period to the current price.
Show OB/OS Boxes: Enable or disable background for overbought and oversold areas.
Realtime: Draw all data in real time.

RSI on overlay chart is same as current RSI on bottom chart

RSI without scale, boxes, or RSI Line
“Repainting” Note: The current RSI level is calculated in real time as each price changes, so yes this does “repaint” on the current bar. This is by design and will not change the effectiveness of the script. However, if you are using this script to generate signals, uncheck “Realtime” and/or use “once per bar close” for alerts.
Settings/Customizations:
RSI Length: Calculate RSI and draw RSI Line for specified period
Overbought Level: Draw maroon box from OB level to highest high.
Oversold Level: Draw green box from lowest low to OS level.
Scale Offset: Fine-tune location of 0-100 scale.
Show Scale: Draw 0-100 levels to the right of the RSI line.
Show RSI Line: Draw a line from the start of the RSI period to the current price.
Show OB/OS Boxes: Enable or disable background for overbought and oversold areas.
Realtime: Draw all data in real time.
RSI on overlay chart is same as current RSI on bottom chart
RSI without scale, boxes, or RSI Line
“Repainting” Note: The current RSI level is calculated in real time as each price changes, so yes this does “repaint” on the current bar. This is by design and will not change the effectiveness of the script. However, if you are using this script to generate signals, uncheck “Realtime” and/or use “once per bar close” for alerts.
开源脚本
秉承TradingView的精神,该脚本的作者将其开源,以便交易者可以查看和验证其功能。向作者致敬!您可以免费使用该脚本,但请记住,重新发布代码须遵守我们的网站规则。
USDT(ERC20):0x89c1ada92d53e88a06131a28693fd46101bdbecb
LTC:LWx9nAqbfZcWB5GBxUuBEpdBCFyVAmSFjm
ETH(ERC20):0x89c1ada92d53e88a06131a28693fd46101bdbecb
BTC:113pXq5Lxdp3UUgTpRng24sxX7YRE9dR61p
LTC:LWx9nAqbfZcWB5GBxUuBEpdBCFyVAmSFjm
ETH(ERC20):0x89c1ada92d53e88a06131a28693fd46101bdbecb
BTC:113pXq5Lxdp3UUgTpRng24sxX7YRE9dR61p
免责声明
这些信息和出版物并非旨在提供,也不构成TradingView提供或认可的任何形式的财务、投资、交易或其他类型的建议或推荐。请阅读使用条款了解更多信息。