PROTECTED SOURCE SCRIPT
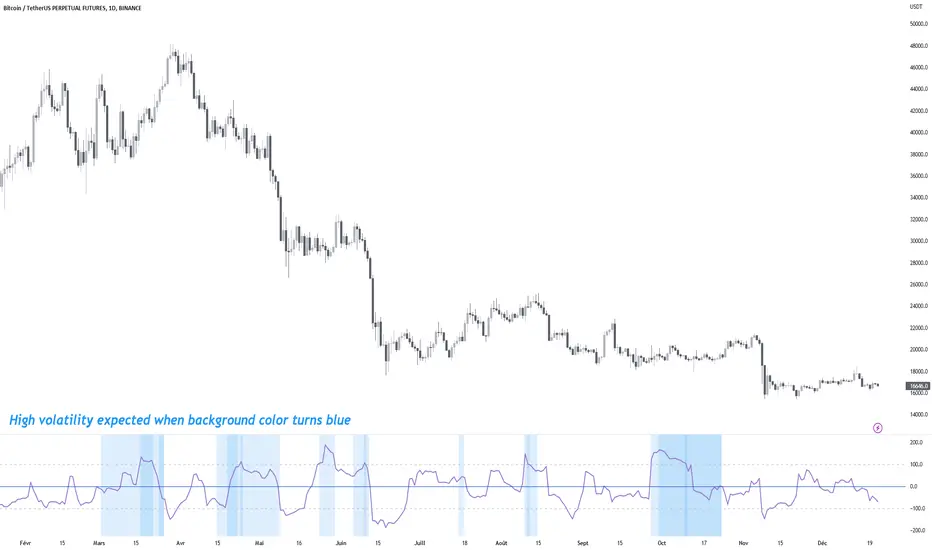
MTF Choppiness Index

Multi Time Frame Choppiness Index
Draw the choppiness index on multiple time frames (maximum 5).
Once a chop is charged on one time frame (above 100), the background will be coloured on the indicator window.
More the background is coloured, more there are charged time frames, and more you can expect high volatility .
A table of charged time frames will appear to indicate which time frame has its chop charged.
By default, the computed time frames will be a factor of your current chart time frame. Go to the Inputs tab in configuration to make them static if you need it.
By default, only the chop line of the current time frame is displayed. Go to the Style tab in configuration to display other time frame lines.
If you are using a lower time frame than your current chart, the line will not be accurate because of missing values.
Made by Trust The Setup 🤖
受保护脚本
此脚本以闭源形式发布。 但是,您可以自由使用,没有任何限制 — 了解更多信息这里。
免责声明
这些信息和出版物并非旨在提供,也不构成TradingView提供或认可的任何形式的财务、投资、交易或其他类型的建议或推荐。请阅读使用条款了解更多信息。
受保护脚本
此脚本以闭源形式发布。 但是,您可以自由使用,没有任何限制 — 了解更多信息这里。
免责声明
这些信息和出版物并非旨在提供,也不构成TradingView提供或认可的任何形式的财务、投资、交易或其他类型的建议或推荐。请阅读使用条款了解更多信息。