OPEN-SOURCE SCRIPT
已更新 Strong Tight Closes in Strong Uptrend
This indicator helps to visually identify "strong tight closes" in an uptrend. It serves to make it easier to spot not only tight but tight AND strong consolidations in an ongoing uptrend for a potential continuation entry. Please keep in mind the indicator counts with distance between Close values of 2 separate candles, that's why it's called "Tight Back to Back Candles". This doesn't identify "tight close" in a sense of very narrow range between Open and Close of a single candle, not any other volatility measures such as average true range etc.
Caution: This is not a complete strategy, it's only a visual tool for making potential continuation patterns easier to spot.
Conditions:
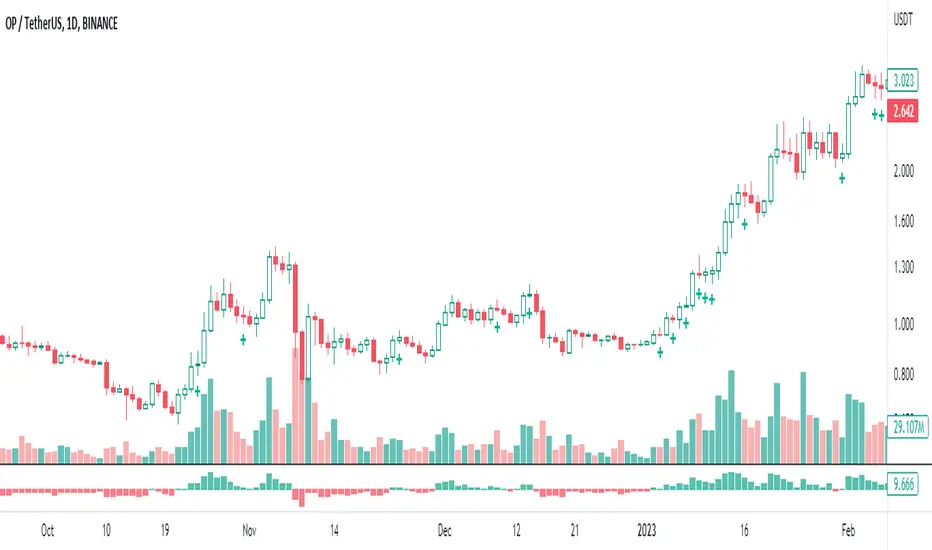
- Measure the difference between CLOSE values of two candles in percentages
- If the difference is lower than a certain threshold set by the user, (1.3% by default) plot a green cross below the latter candle
Filters:
- Low of both candles must be above 10EMA on the current timeframe
- Both Closes must be in the upper half of the candles' Low to High range
Caution: This is not a complete strategy, it's only a visual tool for making potential continuation patterns easier to spot.
Conditions:
- Measure the difference between CLOSE values of two candles in percentages
- If the difference is lower than a certain threshold set by the user, (1.3% by default) plot a green cross below the latter candle
Filters:
- Low of both candles must be above 10EMA on the current timeframe
- Both Closes must be in the upper half of the candles' Low to High range
版本注释
Now AT LEAST one of the candles must close in the UPPER 60% of its Low to High range版本注释
- Default percentage threshold set to 2.0% as it suits better the higher timeframes such as Daily- Candle must CLOSE above 10EMA to pass the filter (previously it was set to LOW of the candle above 10EMA, that was more strict and didn't catch the beginning of trends when EMA is just curling up)
版本注释
User can define whether the condition for price above 10EMA is LOW, HIGH, OPEN or CLOSE开源脚本
秉承TradingView的精神,该脚本的作者将其开源,以便交易者可以查看和验证其功能。向作者致敬!您可以免费使用该脚本,但请记住,重新发布代码须遵守我们的网站规则。
免责声明
这些信息和出版物并非旨在提供,也不构成TradingView提供或认可的任何形式的财务、投资、交易或其他类型的建议或推荐。请阅读使用条款了解更多信息。
免责声明
这些信息和出版物并非旨在提供,也不构成TradingView提供或认可的任何形式的财务、投资、交易或其他类型的建议或推荐。请阅读使用条款了解更多信息。