OPEN-SOURCE SCRIPT
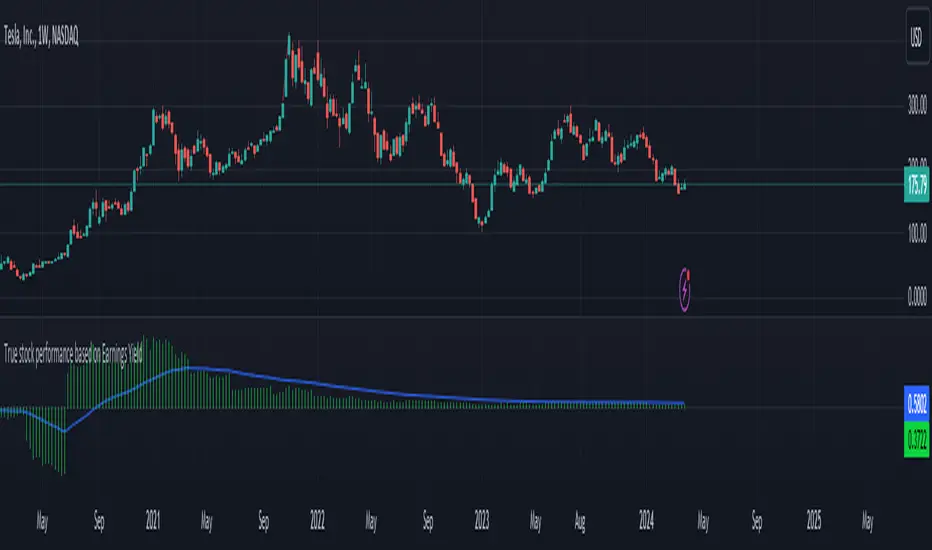
True stock performance based on Earnings Yield
The whole basis of the stock market is that you invest your money into a business that can use that money to increase it's earnings and pay you back for that investment with dividends and increased stock value. But because we are human the market often overbuy stocks that cant keep up their earnings with the current inflow of investments. We can also oversell a stock that is keeping up with earnings in regards to the stock price but we don't care because of the sentiment we have.
Earnings Yield is simply the percentage of Earnings Per Share in relation to the stock price. Alone, it's a great fundamental indicator to analyze a company. But I wanted to use it in another way and got tired of using the calculator all the time so that's why I made this indicator.
The goal is to see if the STOCK price is moving accordingly to the BUSINESS earnings. It works by calculating the difference of EY (TTM) previous close (1 bar) to the close thereafter. It then calculates the stock performance of the latest bar and divides that to get decimal form instead of percent. Then it divides the stock performance in decimal form with the difference of EY calculated before. The result shows how much the stock prices moves in relation to how much EY is moving. The theory is that if EY barely moves but the stock price moves heavily, you have a sentiment driven trend.
Example: Week 1 EY = 1.201. Week 2 EY = 1.105.
1.201 - 1.105 = 0.096
Week 2 performed a 11,2% increase in stock price. = 0.112 in decimal form.
0.112 / 0.096 = 1.67
1.67 is the multiple that plots this indicator.
Here is an good example of a stock that's currently in a highly sentiment driven trend, NVIDIA! (Posted 2024-03-30)

Here is an example of a Swedish stock that retail investors flocked to that have been blowned out completely.

When do I buy and sell?
This indicator is not meant to give exact entries or exits. The purpose is to scout the current and past sentiment, possible divergencies and see if a stock is over or under valued. I did add a 50 EMA to get some form of mean plotted. One could buy when true performance is low and sell when true performance drops below the 50 EMA. You could also just sell a part of your position and set a trailing exit with a ordinary 50 EMA or something like that. Often the sentiment will keep driving the price up. But if it last for 1 month or 1 year is impossible to tell.
Try it out and learn how it works and use it as you like. Cheers!
Earnings Yield is simply the percentage of Earnings Per Share in relation to the stock price. Alone, it's a great fundamental indicator to analyze a company. But I wanted to use it in another way and got tired of using the calculator all the time so that's why I made this indicator.
The goal is to see if the STOCK price is moving accordingly to the BUSINESS earnings. It works by calculating the difference of EY (TTM) previous close (1 bar) to the close thereafter. It then calculates the stock performance of the latest bar and divides that to get decimal form instead of percent. Then it divides the stock performance in decimal form with the difference of EY calculated before. The result shows how much the stock prices moves in relation to how much EY is moving. The theory is that if EY barely moves but the stock price moves heavily, you have a sentiment driven trend.
Example: Week 1 EY = 1.201. Week 2 EY = 1.105.
1.201 - 1.105 = 0.096
Week 2 performed a 11,2% increase in stock price. = 0.112 in decimal form.
0.112 / 0.096 = 1.67
1.67 is the multiple that plots this indicator.
Here is an good example of a stock that's currently in a highly sentiment driven trend, NVIDIA! (Posted 2024-03-30)
Here is an example of a Swedish stock that retail investors flocked to that have been blowned out completely.
When do I buy and sell?
This indicator is not meant to give exact entries or exits. The purpose is to scout the current and past sentiment, possible divergencies and see if a stock is over or under valued. I did add a 50 EMA to get some form of mean plotted. One could buy when true performance is low and sell when true performance drops below the 50 EMA. You could also just sell a part of your position and set a trailing exit with a ordinary 50 EMA or something like that. Often the sentiment will keep driving the price up. But if it last for 1 month or 1 year is impossible to tell.
Try it out and learn how it works and use it as you like. Cheers!
开源脚本
秉承TradingView的精神,该脚本的作者将其开源,以便交易者可以查看和验证其功能。向作者致敬!您可以免费使用该脚本,但请记住,重新发布代码须遵守我们的网站规则。
免责声明
这些信息和出版物并非旨在提供,也不构成TradingView提供或认可的任何形式的财务、投资、交易或其他类型的建议或推荐。请阅读使用条款了解更多信息。
开源脚本
秉承TradingView的精神,该脚本的作者将其开源,以便交易者可以查看和验证其功能。向作者致敬!您可以免费使用该脚本,但请记住,重新发布代码须遵守我们的网站规则。
免责声明
这些信息和出版物并非旨在提供,也不构成TradingView提供或认可的任何形式的财务、投资、交易或其他类型的建议或推荐。请阅读使用条款了解更多信息。