OPEN-SOURCE SCRIPT
已更新 Adaptive Parabolic SAR (PSAR) [Loxx]
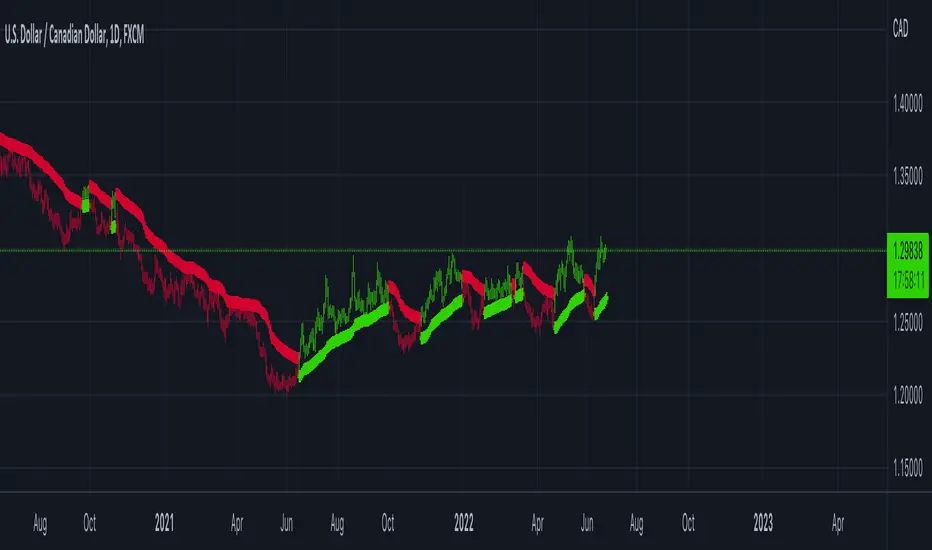
Adaptive Parabolic SAR (PSAR) [Loxx] is an advanced Parabolic SAR with adaptive adjustments using either a Kaufman or an Ehlers smoothing algorithms.
What is the Parabolic SAR?
The parabolic SAR attempts to give traders an edge by highlighting the direction an asset is moving, as well as providing entry and exit points. In this article, we'll look at the basics of this indicator and show you how you can incorporate it into your trading strategy. We'll also look at some of the drawbacks of the indicator.
The parabolic SAR is a technical indicator used to determine the price direction of an asset, as well as draw attention to when the price direction is changing. Sometimes known as the "stop and reversal system," the parabolic SAR was developed by J. Welles Wilder Jr., creator of the relative strength index (RSI).1
On a chart, the indicator appears as a series of dots placed either above or below the price bars. A dot below the price is deemed to be a bullish signal. Conversely, a dot above the price is used to illustrate that the bears are in control and that the momentum is likely to remain downward. When the dots flip, it indicates that a potential change in price direction is under way. For example, if the dots are above the price, when they flip below the price, it could signal a further rise in price.
Additional Options
Enjoy!
What is the Parabolic SAR?
The parabolic SAR attempts to give traders an edge by highlighting the direction an asset is moving, as well as providing entry and exit points. In this article, we'll look at the basics of this indicator and show you how you can incorporate it into your trading strategy. We'll also look at some of the drawbacks of the indicator.
The parabolic SAR is a technical indicator used to determine the price direction of an asset, as well as draw attention to when the price direction is changing. Sometimes known as the "stop and reversal system," the parabolic SAR was developed by J. Welles Wilder Jr., creator of the relative strength index (RSI).1
On a chart, the indicator appears as a series of dots placed either above or below the price bars. A dot below the price is deemed to be a bullish signal. Conversely, a dot above the price is used to illustrate that the bears are in control and that the momentum is likely to remain downward. When the dots flip, it indicates that a potential change in price direction is under way. For example, if the dots are above the price, when they flip below the price, it could signal a further rise in price.
Additional Options
- Toggle signals on/off
- HiLo mode
- Kaufman adaptive, Ehlers adaptive, or non adaptive
- Filter by Pips
- Minimum Change by Pips
- Color bars
Enjoy!
版本注释
Updated pip cutoffs and filters版本注释
Updated to handle JPY and other assets on pip filters.开源脚本
秉承TradingView的精神,该脚本的作者将其开源,以便交易者可以查看和验证其功能。向作者致敬!您可以免费使用该脚本,但请记住,重新发布代码须遵守我们的网站规则。
Public Telegram Group, t.me/algxtrading_public
VIP Membership Info: patreon.com/algxtrading/membership
VIP Membership Info: patreon.com/algxtrading/membership
免责声明
这些信息和出版物并非旨在提供,也不构成TradingView提供或认可的任何形式的财务、投资、交易或其他类型的建议或推荐。请阅读使用条款了解更多信息。
开源脚本
秉承TradingView的精神,该脚本的作者将其开源,以便交易者可以查看和验证其功能。向作者致敬!您可以免费使用该脚本,但请记住,重新发布代码须遵守我们的网站规则。
Public Telegram Group, t.me/algxtrading_public
VIP Membership Info: patreon.com/algxtrading/membership
VIP Membership Info: patreon.com/algxtrading/membership
免责声明
这些信息和出版物并非旨在提供,也不构成TradingView提供或认可的任何形式的财务、投资、交易或其他类型的建议或推荐。请阅读使用条款了解更多信息。