OPEN-SOURCE SCRIPT
已更新 Trinity Multi-Timeframe MA Trend
Original script can be found here: {Multi-Timeframe Trend Analysis [BigBeluga]} tradingview.com/script/zfkp3wZA-Multi-Timeframe-Trend-Analysis-BigBeluga/$0
1. all credit the original author tradingview.com/u/BigBeluga/
2. why change this script:
- added full transparency function to each EMA
- changed to up and down arrows
- change the dashboard to be able to resize and reposition
How to Use This Indicator
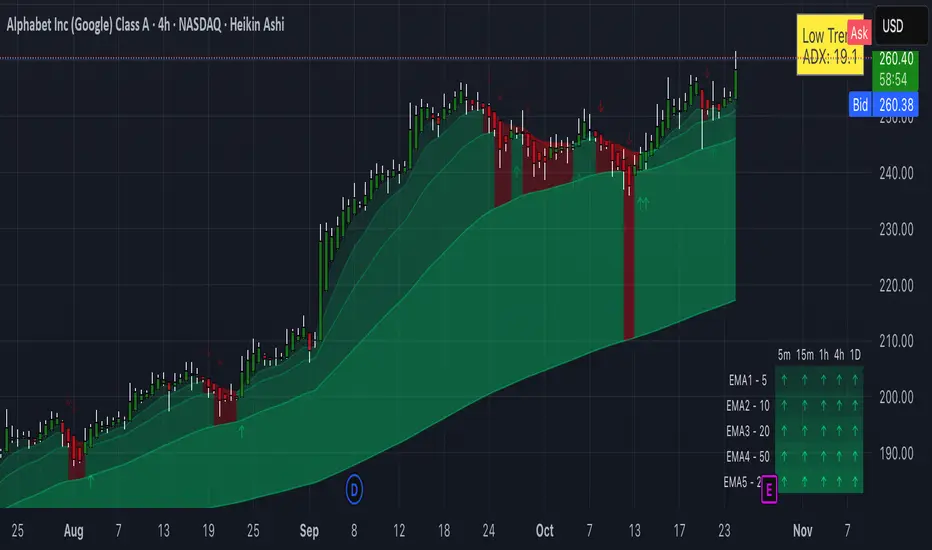
This indicator, "Trinity Multi-Timeframe MA Trend," is designed for TradingView and helps visualize Exponential Moving Average (EMA) trends across multiple timeframes. It plots EMAs on your chart, fills areas between them with directional colors (up or down), shows crossover/crossunder labels, and displays a dashboard table summarizing EMA directions (bullish ↑ or bearish ↓) for selected timeframes. It's useful for multi-timeframe analysis in trading strategies, like confirming trends before entries.
Configure Settings (via the Gear Icon on the Indicator Title):
Timeframes Group: Set up to 5 custom timeframes (e.g., "5" for 5 minutes, "60" for 1 hour). These determine the multi-timeframe analysis in the dashboard. Defaults: 5m, 15m, 1h, 4h, 5h.
EMA Group: Adjust the lengths of the 5 EMAs (defaults: 5, 10, 20, 50, 200). These are the moving averages plotted on the chart.
Colors (Inline "c"): Choose uptrend color (default: lime/green) and downtrend color (default: purple). These apply to plots, fills, labels, and dashboard cells.
Transparencies Group: Set transparency levels (0-100) for each EMA's plot and fill (0 = opaque, 100 = fully transparent). Defaults decrease from EMA1 (80) to EMA5 (0) for a gradient effect.
Dashboard Settings Group (newly added):
Dashboard Position: Select where the table appears (Top Right, Top Left, Bottom Right, Bottom Left).
Dashboard Size: Choose text size (Tiny, Small, Normal, Large, Huge) to scale the table for better visibility on crowded charts.
Understanding the Visuals:
EMA Plots: Five colored lines on the chart (EMA1 shortest, EMA5 longest). Color changes based on direction: uptrend (your selected up color) if rising, downtrend (down color) if falling.
Fills Between EMAs: Shaded areas between consecutive EMAs, colored and transparent based on the faster EMA's direction and your transparency settings.
Crossover Labels: Arrow labels (↑ for crossover/uptrend start, ↓ for crossunder/downtrend start) appear on the chart at EMA direction changes, with tooltips like "EMA1".
Dashboard Table (top-right by default):
Rows: EMA1 to EMA5 (with lengths shown).
Columns: Selected timeframes (converted to readable format, e.g., "5m", "1h").
Cells: ↑ (bullish/up) or ↓ (bearish/down) arrows, colored green/lime or purple based on trend, with fading transparency for visual hierarchy.
Use this to quickly check alignment across timeframes (e.g., all ↑ in multiple TFs might signal a strong uptrend).
Trading Tips:
Trend Confirmation: Look for alignment where most EMAs in higher timeframes are ↑ (bullish) or ↓ (bearish).
Entries/Exits: Use crossovers on the chart EMAs as signals, confirmed by the dashboard (e.g., enter long if lower TF EMA crosses up and higher TFs are aligned).
Customization: On lower timeframe charts, set dashboard timeframes to higher ones for top-down analysis. Adjust transparencies to avoid chart clutter.
Limitations: This is a trend-following tool; combine with volume, support/resistance, or other indicators. Backtest on historical data before live use.
Performance: Works best on trending markets; may whipsaw in sideways conditions.
1. all credit the original author tradingview.com/u/BigBeluga/
2. why change this script:
- added full transparency function to each EMA
- changed to up and down arrows
- change the dashboard to be able to resize and reposition
How to Use This Indicator
This indicator, "Trinity Multi-Timeframe MA Trend," is designed for TradingView and helps visualize Exponential Moving Average (EMA) trends across multiple timeframes. It plots EMAs on your chart, fills areas between them with directional colors (up or down), shows crossover/crossunder labels, and displays a dashboard table summarizing EMA directions (bullish ↑ or bearish ↓) for selected timeframes. It's useful for multi-timeframe analysis in trading strategies, like confirming trends before entries.
Configure Settings (via the Gear Icon on the Indicator Title):
Timeframes Group: Set up to 5 custom timeframes (e.g., "5" for 5 minutes, "60" for 1 hour). These determine the multi-timeframe analysis in the dashboard. Defaults: 5m, 15m, 1h, 4h, 5h.
EMA Group: Adjust the lengths of the 5 EMAs (defaults: 5, 10, 20, 50, 200). These are the moving averages plotted on the chart.
Colors (Inline "c"): Choose uptrend color (default: lime/green) and downtrend color (default: purple). These apply to plots, fills, labels, and dashboard cells.
Transparencies Group: Set transparency levels (0-100) for each EMA's plot and fill (0 = opaque, 100 = fully transparent). Defaults decrease from EMA1 (80) to EMA5 (0) for a gradient effect.
Dashboard Settings Group (newly added):
Dashboard Position: Select where the table appears (Top Right, Top Left, Bottom Right, Bottom Left).
Dashboard Size: Choose text size (Tiny, Small, Normal, Large, Huge) to scale the table for better visibility on crowded charts.
Understanding the Visuals:
EMA Plots: Five colored lines on the chart (EMA1 shortest, EMA5 longest). Color changes based on direction: uptrend (your selected up color) if rising, downtrend (down color) if falling.
Fills Between EMAs: Shaded areas between consecutive EMAs, colored and transparent based on the faster EMA's direction and your transparency settings.
Crossover Labels: Arrow labels (↑ for crossover/uptrend start, ↓ for crossunder/downtrend start) appear on the chart at EMA direction changes, with tooltips like "EMA1".
Dashboard Table (top-right by default):
Rows: EMA1 to EMA5 (with lengths shown).
Columns: Selected timeframes (converted to readable format, e.g., "5m", "1h").
Cells: ↑ (bullish/up) or ↓ (bearish/down) arrows, colored green/lime or purple based on trend, with fading transparency for visual hierarchy.
Use this to quickly check alignment across timeframes (e.g., all ↑ in multiple TFs might signal a strong uptrend).
Trading Tips:
Trend Confirmation: Look for alignment where most EMAs in higher timeframes are ↑ (bullish) or ↓ (bearish).
Entries/Exits: Use crossovers on the chart EMAs as signals, confirmed by the dashboard (e.g., enter long if lower TF EMA crosses up and higher TFs are aligned).
Customization: On lower timeframe charts, set dashboard timeframes to higher ones for top-down analysis. Adjust transparencies to avoid chart clutter.
Limitations: This is a trend-following tool; combine with volume, support/resistance, or other indicators. Backtest on historical data before live use.
Performance: Works best on trending markets; may whipsaw in sideways conditions.
版本注释
MA Type Selection: Users can now choose between EMA, SMA, or HMA for each of the 5 moving averages.Enable/Disable Options: to toggle visibility of each MA (lines, fills, arrows, and dashboard rows).
Dynamic Dashboard: The dashboard now dynamically adjusts rows based on enabled MAs, excluding disabled ones. If no MAs are enabled, it displays "No MAs enabled" instead of disappearing.
版本注释
I fixed an out-of-bounds error in the table by addressing a variable accumulation issue with row_count. Previously, it was declared with var inside the barstate.islast block, which caused it to increment repeatedly across script updates without resetting, eventually exceeding the fixed 6-row table limit. I adjusted the table.clear to use the dynamic row_count for the row range.This prevents the row index from going beyond the table's bounds, even during realtime updates or long historical bars.
开源脚本
秉承TradingView的精神,该脚本的作者将其开源,以便交易者可以查看和验证其功能。向作者致敬!您可以免费使用该脚本,但请记住,重新发布代码须遵守我们的网站规则。
免责声明
这些信息和出版物并非旨在提供,也不构成TradingView提供或认可的任何形式的财务、投资、交易或其他类型的建议或推荐。请阅读使用条款了解更多信息。
开源脚本
秉承TradingView的精神,该脚本的作者将其开源,以便交易者可以查看和验证其功能。向作者致敬!您可以免费使用该脚本,但请记住,重新发布代码须遵守我们的网站规则。
免责声明
这些信息和出版物并非旨在提供,也不构成TradingView提供或认可的任何形式的财务、投资、交易或其他类型的建议或推荐。请阅读使用条款了解更多信息。