PROTECTED SOURCE SCRIPT
Brekout Up/Dn 9:15 Candle
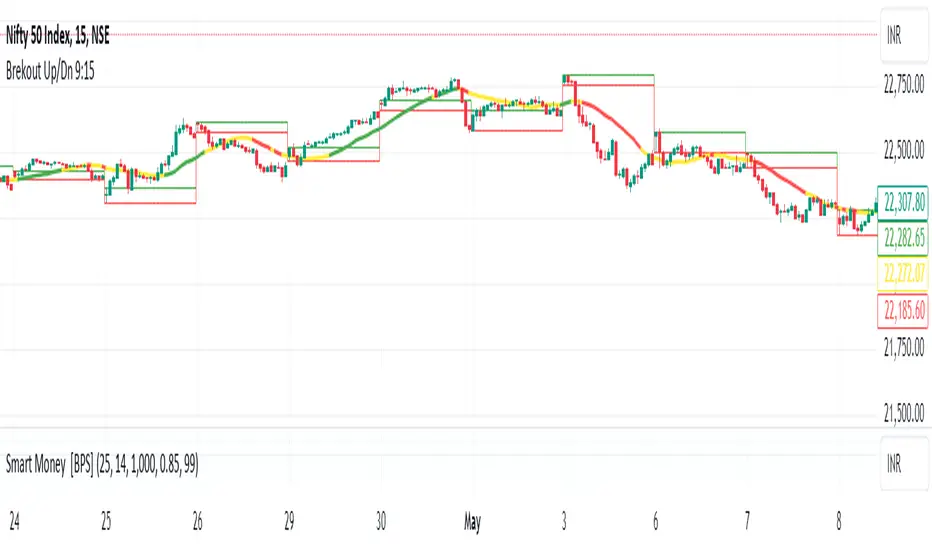
Certainly! Let’s break down the concepts of “Breakout Up/Dn 9:15” and the Relative Strength Index (RSI):
Breakout Up/Dn 9:15:
This refers to a stock breakout strategy that occurs within the first 15 minutes of the trading day (between 9:15 AM and 9:20 AM).
The goal is to identify strong support or resistance levels during this early market activity.
The following filters are typically applied to stocks in the cash segment:
The 15-minute closing price must be greater than the 15-minute maximum of either the last 20 closing prices or the current closing price.
The 15-minute volume should be higher than the 15-minute simple moving average (SMA) of volume over the past 20 periods.
The daily closing price should be less than or equal to a specified value (e.g., 2000).
The 15-minute RSI (14-period) should be greater than or equal to a certain threshold (e.g., 75).
If a stock meets all these conditions, it is considered a breakout candidate.
Note that this scan is based on delayed data, and real-time scans are available with a premium subscription1.
Relative Strength Index (RSI):
The RSI is a momentum oscillator that measures the speed and change of price movements.
It ranges from 0 to 100 and is commonly used to identify overbought or oversold conditions.
Key points about RSI:
RSI values above 70 indicate overbought conditions (potential reversal downward).
RSI values below 30 indicate oversold conditions (potential reversal upward).
Traders often look for RSI crossovers, divergences, and retests of breakout levels.
RSI can be used in various trading strategies, including breakout retests and alerts2.
Remember that these are just brief descriptions, and there’s much more to explore in both breakout strategies
受保护脚本
此脚本以闭源形式发布。 但是,您可以自由使用它,没有任何限制 — 在此处了解更多信息。
免责声明
这些信息和出版物并不意味着也不构成TradingView提供或认可的金融、投资、交易或其它类型的建议或背书。请在使用条款阅读更多信息。
受保护脚本
此脚本以闭源形式发布。 但是,您可以自由使用它,没有任何限制 — 在此处了解更多信息。
免责声明
这些信息和出版物并不意味着也不构成TradingView提供或认可的金融、投资、交易或其它类型的建议或背书。请在使用条款阅读更多信息。