OPEN-SOURCE SCRIPT
已更新 MM Market Range Map
What this script does:
The purpose of this script is to help traders identify when the major sectors of the market are moving in one direction - also known as a "market trend day".
How this script works:
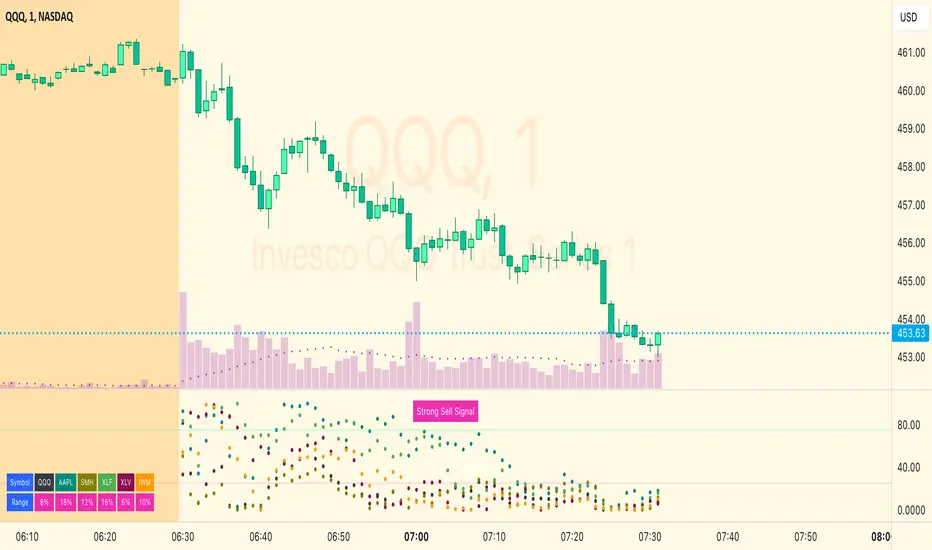
The indicator uses QQQ, SMH and NVDA to represent the technology side of the market, and XLF, XLV & IWM to represent everything else. It tracks where price is within the day's range for each of those symbols, and presents that data in a table and in also in a dot-based "map".
How to use this script:
Using the dot-based map, you can see if all symbols were ever at the highs or lows of their range together. You can use this information to decide which direction you should be trading (ie. with trend). For example, in order for there to be healthy bullish moves in the market, you would want this indicator to show you that all sectors are at the highs or trending in that direction.
What makes this script original:
Most indicators and even the TradingView watchlist measure the percent changed on the day from the closing price of a stock on the prior trading day, essentially telling you what sentiment is since yesterday. This script tells you the sentiment today since it is priced from the opening print. It also provides the map so you can see if they were ever at the highs or lows together throughout the day, which can be an early indicator that the market will trend.
The purpose of this script is to help traders identify when the major sectors of the market are moving in one direction - also known as a "market trend day".
How this script works:
The indicator uses QQQ, SMH and NVDA to represent the technology side of the market, and XLF, XLV & IWM to represent everything else. It tracks where price is within the day's range for each of those symbols, and presents that data in a table and in also in a dot-based "map".
How to use this script:
Using the dot-based map, you can see if all symbols were ever at the highs or lows of their range together. You can use this information to decide which direction you should be trading (ie. with trend). For example, in order for there to be healthy bullish moves in the market, you would want this indicator to show you that all sectors are at the highs or trending in that direction.
What makes this script original:
Most indicators and even the TradingView watchlist measure the percent changed on the day from the closing price of a stock on the prior trading day, essentially telling you what sentiment is since yesterday. This script tells you the sentiment today since it is priced from the opening print. It also provides the map so you can see if they were ever at the highs or lows together throughout the day, which can be an early indicator that the market will trend.
版本注释
Updates:- Switched NVDA with AAPL to get a better sense of tech overall (SMH should account for NVDA)
- Added sentiment thresholds & lines for those levels (optionally)
- Added alerts for (a) all sectors at lows, (b) all sectors at highs, and (c) healthy sector rotation
- Added strong buy or sell signal messages
版本注释
Added alerts for just QQQ, XLF, XLV at highs/lows. Updating chart.版本注释
Fixed a bug where the values didn't display on non-equities charts.版本注释
Changed the indicator to allow users to customize or disable the symbols. Had to change the alerts also to account for this change. Now it will only alert when all enabled symbols are at highs or lows.开源脚本
秉承TradingView的精神,该脚本的作者将其开源,以便交易者可以查看和验证其功能。向作者致敬!您可以免费使用该脚本,但请记住,重新发布代码须遵守我们的网站规则。
I release TradingView indicators and libraries designed to make you a better trader. For detailed info about them, head over to improve.trading
免责声明
这些信息和出版物并非旨在提供,也不构成TradingView提供或认可的任何形式的财务、投资、交易或其他类型的建议或推荐。请阅读使用条款了解更多信息。
开源脚本
秉承TradingView的精神,该脚本的作者将其开源,以便交易者可以查看和验证其功能。向作者致敬!您可以免费使用该脚本,但请记住,重新发布代码须遵守我们的网站规则。
I release TradingView indicators and libraries designed to make you a better trader. For detailed info about them, head over to improve.trading
免责声明
这些信息和出版物并非旨在提供,也不构成TradingView提供或认可的任何形式的财务、投资、交易或其他类型的建议或推荐。请阅读使用条款了解更多信息。