OPEN-SOURCE SCRIPT
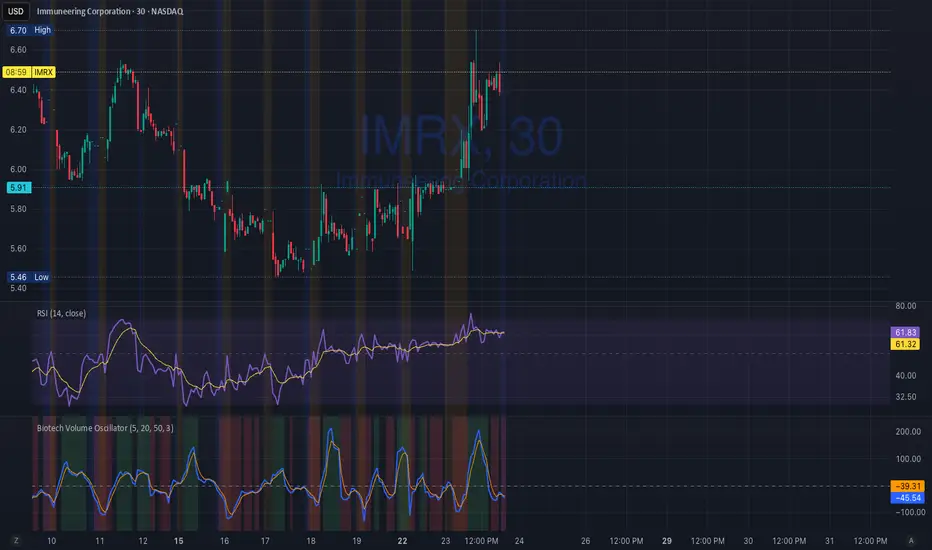
Biotech Volume Oscillator
1️⃣ What This Indicator Is (In One Sentence)
It tells you whether people are actually showing up to trade the stock, or if price is just drifting around on low interest.
That’s it.
It does not predict price.
It tells you whether a move is real or fragile.
2️⃣ What the Lines Mean
You see two lines:
🔵 Blue Line = Live Participation
Fast
Reacts immediately
Shows what traders are doing right now
Think:
“Is anyone actually trading this candle?”
🟠 Orange Line = Accepted Participation
Slower
Smoothed
Shows what the market has decided is normal
Think:
“Is this level of activity sticking?”
3️⃣ What the Numbers Mean (Very Important)
The numbers are percentages vs normal volume for this stock.
Around 0
Volume is normal
Nothing special happening
+10 to +25
Healthy interest
Traders are paying attention
Moves can continue
Above +25
Abnormal participation
News, hype, or institutions involved
Moves here tend to be fast
Below –20
Participation drying up
Drift, chop, fake breakouts
Below –30
Nobody is home
Price can move, but it’s fragile
Breakouts usually fail
4️⃣ How to Use It (Step-by-Step)
Step 1: Ignore Price for a Second
Look only at the oscillator.
Ask:
“Is this above zero or below zero?”
Step 2: Look at Direction
Rising oscillator → interest increasing
Falling oscillator → interest fading
Step 3: Compare Blue vs Orange
✅ Good / Healthy
Blue above orange
Both rising
→ New participation is entering
⚠️ Warning
Price rising
Blue flat or falling
Orange flat
→ Float, not conviction
🚨 Distribution
Blue rolls over from high levels
Orange follows
Price still looks “fine”
→ Selling into strength
开源脚本
秉承TradingView的精神,该脚本的作者将其开源,以便交易者可以查看和验证其功能。向作者致敬!您可以免费使用该脚本,但请记住,重新发布代码须遵守我们的网站规则。
免责声明
这些信息和出版物并非旨在提供,也不构成TradingView提供或认可的任何形式的财务、投资、交易或其他类型的建议或推荐。请阅读使用条款了解更多信息。
开源脚本
秉承TradingView的精神,该脚本的作者将其开源,以便交易者可以查看和验证其功能。向作者致敬!您可以免费使用该脚本,但请记住,重新发布代码须遵守我们的网站规则。
免责声明
这些信息和出版物并非旨在提供,也不构成TradingView提供或认可的任何形式的财务、投资、交易或其他类型的建议或推荐。请阅读使用条款了解更多信息。