OPEN-SOURCE SCRIPT
已更新 OBV Overbuy+sell by RSU
On-balance volume (OBV) is a technical trading momentum indicator that uses volume flow to predict changes in stock price. Joseph Granville first developed the OBV metric in the 1963 book Granville's New Key to Stock Market Profits.
This indicator is based on the OBV indicator and adds 2 times the standard deviation Bollinger Band to evaluate the overbought and oversold phenomenon of the OBV indicator.
The characteristics of Bollinger Bands: According to the normal distribution phenomenon, only 5% of the cases will exceed 2 times the standard deviation of the Bollinger Bands. So when it exceeds, I will use colors to mark red overbought and green oversold situations.
Usage:
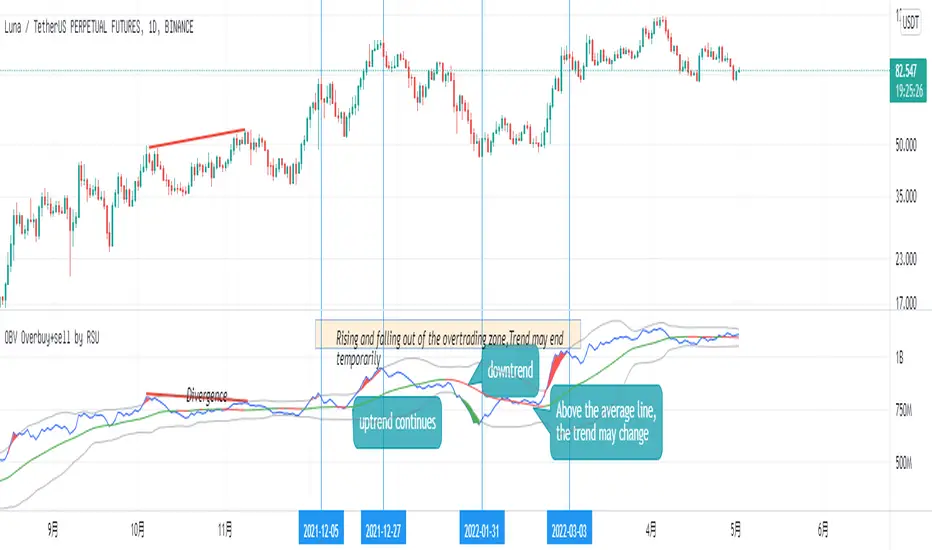
1.Identify trends: Identify current stock trends by OBV's 30 average line color.
2.Breakthrough:A break below overbuy could signal a temporary end to the uptrend.
3.Oversell and overbuy:A break below overbuy could signal a temporary end to the uptrend.
4.Divergence:When the slope of the two highs is opposite to the slope of the two highs of the indicator, a trend reversal signal may occur.
This indicator is based on the OBV indicator and adds 2 times the standard deviation Bollinger Band to evaluate the overbought and oversold phenomenon of the OBV indicator.
The characteristics of Bollinger Bands: According to the normal distribution phenomenon, only 5% of the cases will exceed 2 times the standard deviation of the Bollinger Bands. So when it exceeds, I will use colors to mark red overbought and green oversold situations.
Usage:
1.Identify trends: Identify current stock trends by OBV's 30 average line color.
2.Breakthrough:A break below overbuy could signal a temporary end to the uptrend.
3.Oversell and overbuy:A break below overbuy could signal a temporary end to the uptrend.
4.Divergence:When the slope of the two highs is opposite to the slope of the two highs of the indicator, a trend reversal signal may occur.
版本注释
change:Added smoothing parameter to reduce sawtooth.
Usage:
1.Identify trends: Identify current stock trends by OBV's 30 average line color.
2.Breakthrough:OBV Breakthrough 30 average,signal trend may reversal.
3.Oversell and overbuy:A break below overbuy could signal a temporary end to the uptrend.
4.Divergence:When the slope of the two highs is opposite to the slope of the two highs of the indicator, a trend reversal signal may occur.
版本注释
changes:Added 1x Bollinger Bands display, updated colors.开源脚本
秉承TradingView的精神,该脚本的作者将其开源,以便交易者可以查看和验证其功能。向作者致敬!您可以免费使用该脚本,但请记住,重新发布代码须遵守我们的网站规则。
免责声明
这些信息和出版物并非旨在提供,也不构成TradingView提供或认可的任何形式的财务、投资、交易或其他类型的建议或推荐。请阅读使用条款了解更多信息。
免责声明
这些信息和出版物并非旨在提供,也不构成TradingView提供或认可的任何形式的财务、投资、交易或其他类型的建议或推荐。请阅读使用条款了解更多信息。