OPEN-SOURCE SCRIPT
已更新 ADX and DI Trend meter and status table Indicator
This ADX (Average Directional Index) and DI (Directional Indicator) indicator helps identify:
Trend Direction & Strength:
LONG: +DI above -DI with ADX > 20
SHORT: -DI above +DI with ADX > 20
RANGE: ADX < 20 indicates choppy/sideways market
Trading Signals:
Bullish: +DI crosses above -DI (green triangle)
Bearish: -DI crosses below +DI (red triangle)
ADX Strength Levels:
Strong: ADX ≥ 50
Moderate: ADX 30-49
Weak: ADX 20-29
No Trend: ADX < 20
Best Uses:
Trend confirmation before entering trades
Identifying ranging vs trending markets
Exit signal when trend weakens
Works well on multiple timeframes
Most effective in combination with other indicators
The table displays current trend direction and ADX strength in real-time
版本注释
# Neutral ADX Trend StrengthA clean, modern implementation of the Average Directional Index (ADX) with trend detection and enhanced visual features. This indicator provides a neutral color palette and minimalist design while delivering powerful trend analysis.
---
## Features
- **Professional Appearance**: Neutral color palette with clean, modern styling
- **Enhanced ADX Visualization**: Clear representation of ADX, +DI, and -DI values
- **Smooth Area Fills**: Subtle area fills replace traditional columns for a cleaner look
- **Real-time Trend Signals**: Continuous position signals (0 to 1) for trend detection
- **Trend Strength Table**: Compact table showing current trend direction and strength
- **Customizable Settings**: Adjustable lengths, colors, and display options
---
## Indicator Components
### 1. ADX & Directional Indicators
- **ADX Line**: Measures overall trend strength regardless of direction
- **+DI Line**: Measures upward price movement strength (bullish)
- **-DI Line**: Measures downward price movement strength (bearish)
- **Threshold Line**: Customizable reference for minimum trend strength
### 2. Trend Signals
- **Long Signal**: Activates when +DI > -DI and ADX > Threshold
- **Short Signal**: Activates when -DI > +DI and ADX > Threshold
- **Toggle Option**: Ability to hide signals when needed
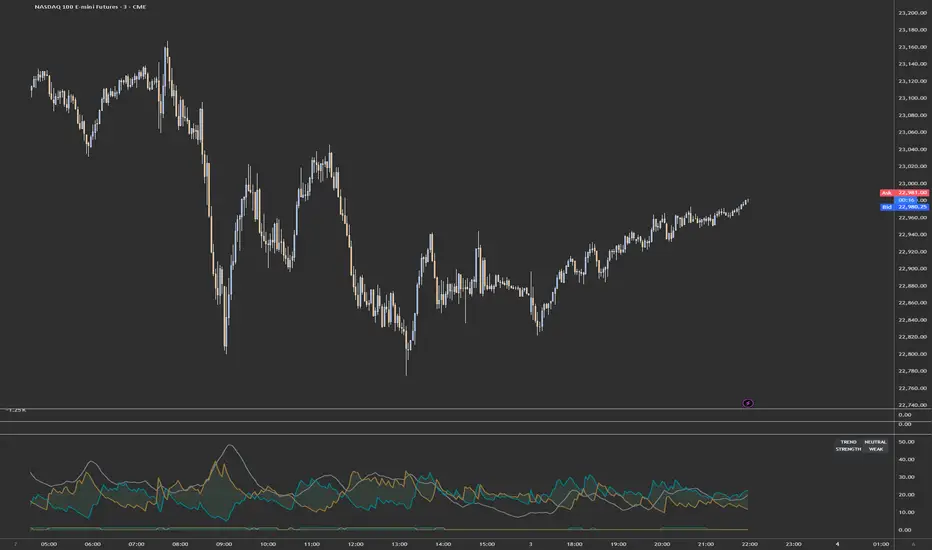
### 3. Trend Table
- **Direction**: Shows BULLISH, BEARISH, or NEUTRAL status
- **Strength**: Classifies trend as WEAK, MODERATE, STRONG, or VERY STRONG
- **Toggle Option**: Ability to hide the table when needed
---
## How to Use
### Trend Direction
- When the +DI line (teal) crosses above the -DI line (brown), look for bullish opportunities
- When the -DI line (brown) crosses above the +DI line (teal), look for bearish opportunities
### Trend Strength
- ADX below 20: No significant trend (range market)
- ADX 20-25: Early trend development
- ADX 25-35: Moderate trend strength
- ADX 35-50: Strong trend in progress
- ADX above 50: Very strong, potentially overextended trend
### Signal Interpretation
- When Long Signal = 1.0: Strong bullish trend conditions
- When Short Signal = 1.0: Strong bearish trend conditions
- When both signals = 0: Weak trend or ranging market
---
## Settings
### Main Parameters
- **ADX Length**: Calculation period for the ADX (default: 14)
- **DI Smoothing**: Smoothing period for directional indicators (default: 14)
- **ADX Threshold**: Minimum ADX value for trend signals (default: 20)
### Visual Options
- **Color Scheme**: Neutral teal (bullish), brown (bearish), and gray (ADX) palette
- **Area Transparency**: Adjust fill opacity to suit your chart style
- **Show/Hide Signals**: Toggle display of continuous trend signals
- **Show/Hide Table**: Toggle display of the trend direction/strength table
---
## Tips for Traders
- Combine with price action confirmation for best results
- Use higher timeframes for more reliable trend signals
- Consider ADX divergence from price for potential trend exhaustion
- Pay attention to how quickly ADX rises or falls when analyzing momentum
---
## About ADX
The Average Directional Index (ADX) was developed by J. Welles Wilder to quantify trend strength. Unlike other indicators that focus on direction, ADX specifically measures the strength of a trend regardless of whether it's up or down. The indicator includes the ADX line itself plus two directional components (+DI and -DI) that help determine trend direction.
---
## Compatibility
Designed for TradingView Pine Script v5. Compatible with all chart types and timeframes.
---
*This indicator is designed for educational and informational purposes only and should not be considered financial advice.*
版本注释
# ADX Trend StrengthA clean, modern implementation of the Average Directional Index (ADX) with trend detection and enhanced visual features. This indicator provides a neutral color palette and minimalist design while delivering powerful trend analysis.
---
## Features
- **Professional Appearance**: Neutral color palette with clean, modern styling
- **Enhanced ADX Visualization**: Clear representation of ADX, +DI, and -DI values
- **Smooth Area Fills**: Subtle area fills replace traditional columns for a cleaner look
- **Real-time Trend Signals**: Continuous position signals (0 to 1) for trend detection
- **Trend Strength Table**: Compact table showing current trend direction and strength
- **Customizable Settings**: Adjustable lengths, colors, and display options
---
## Indicator Components
### 1. ADX & Directional Indicators
- **ADX Line**: Measures overall trend strength regardless of direction
- **+DI Line**: Measures upward price movement strength (bullish)
- **-DI Line**: Measures downward price movement strength (bearish)
- **Threshold Line**: Customizable reference for minimum trend strength
### 2. Trend Signals
- **Long Signal**: Activates when +DI > -DI and ADX > Threshold
- **Short Signal**: Activates when -DI > +DI and ADX > Threshold
- **Toggle Option**: Ability to hide signals when needed
### 3. Trend Table
- **Direction**: Shows BULLISH, BEARISH, or NEUTRAL status
- **Strength**: Classifies trend as WEAK, MODERATE, STRONG, or VERY STRONG
- **Toggle Option**: Ability to hide the table when needed
---
## How to Use
### Trend Direction
- When the +DI line (teal) crosses above the -DI line (brown), look for bullish opportunities
- When the -DI line (brown) crosses above the +DI line (teal), look for bearish opportunities
### Trend Strength
- ADX below 20: No significant trend (range market)
- ADX 20-25: Early trend development
- ADX 25-35: Moderate trend strength
- ADX 35-50: Strong trend in progress
- ADX above 50: Very strong, potentially overextended trend
### Signal Interpretation
- When Long Signal = 1.0: Strong bullish trend conditions
- When Short Signal = 1.0: Strong bearish trend conditions
- When both signals = 0: Weak trend or ranging market
---
## Settings
### Main Parameters
- **ADX Length**: Calculation period for the ADX (default: 14)
- **DI Smoothing**: Smoothing period for directional indicators (default: 14)
- **ADX Threshold**: Minimum ADX value for trend signals (default: 20)
### Visual Options
- **Color Scheme**: Neutral teal (bullish), brown (bearish), and gray (ADX) palette
- **Area Transparency**: Adjust fill opacity to suit your chart style
- **Show/Hide Signals**: Toggle display of continuous trend signals
- **Show/Hide Table**: Toggle display of the trend direction/strength table
---
## Tips for Traders
- Combine with price action confirmation for best results
- Use higher timeframes for more reliable trend signals
- Consider ADX divergence from price for potential trend exhaustion
- Pay attention to how quickly ADX rises or falls when analyzing momentum
---
## About ADX
The Average Directional Index (ADX) was developed by J. Welles Wilder to quantify trend strength. Unlike other indicators that focus on direction, ADX specifically measures the strength of a trend regardless of whether it's up or down. The indicator includes the ADX line itself plus two directional components (+DI and -DI) that help determine trend direction.
---
## Compatibility
Designed for TradingView Pine Script v5. Compatible with all chart types and timeframes.
---
*This indicator is designed for educational and informational purposes only and should not be considered financial advice.*
开源脚本
秉承TradingView的精神,该脚本的作者将其开源,以便交易者可以查看和验证其功能。向作者致敬!您可以免费使用该脚本,但请记住,重新发布代码须遵守我们的网站规则。
免责声明
这些信息和出版物并非旨在提供,也不构成TradingView提供或认可的任何形式的财务、投资、交易或其他类型的建议或推荐。请阅读使用条款了解更多信息。
开源脚本
秉承TradingView的精神,该脚本的作者将其开源,以便交易者可以查看和验证其功能。向作者致敬!您可以免费使用该脚本,但请记住,重新发布代码须遵守我们的网站规则。
免责声明
这些信息和出版物并非旨在提供,也不构成TradingView提供或认可的任何形式的财务、投资、交易或其他类型的建议或推荐。请阅读使用条款了解更多信息。