OPEN-SOURCE SCRIPT
VectorCoresAI SMA + Bollinger Fusion v1
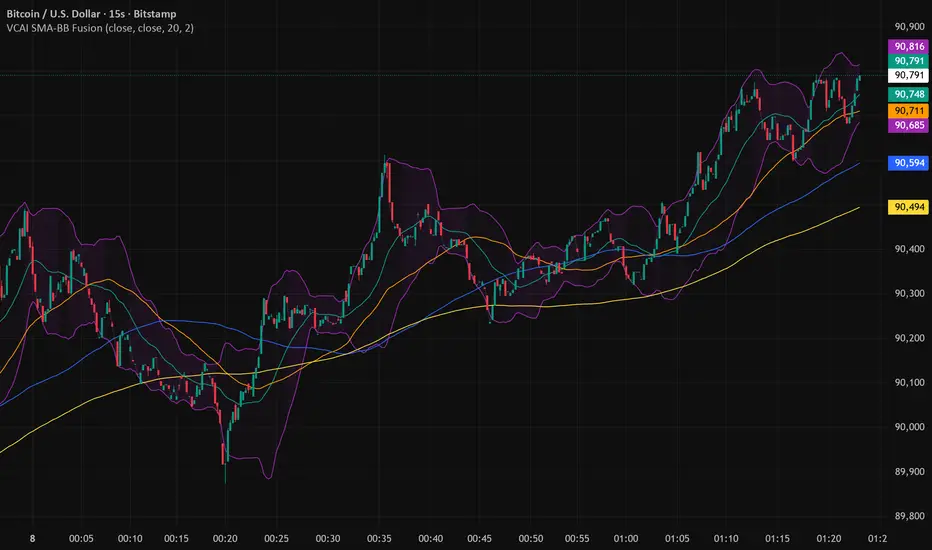
VectorCoresAI — SMA + Bollinger Fusion (Free)
A clean, modern visual tool combining four key SMAs with an adaptive Bollinger structure.
This script merges two of the most widely used charting concepts into one simple, readable view:
Included
✔ SMA 21
✔ SMA 50
✔ SMA 100
✔ SMA 200
✔ Bollinger Bands with adjustable length + multiplier
✔ Adaptive “Fusion Squeeze” shading to highlight compression phases
✔ Optional visibility toggles for each SMA
✔ Lightweight, non-intrusive overlay
What this indicator is designed for
This tool helps traders quickly understand:
Trend alignment using the 21/50/100/200 SMAs
Volatility conditions around the Bollinger midline
Price compression and expansion
Early awareness of breakout environments
Clean visual structure without clutter
Everything is intentionally simple and transparent.
No predictions, no signals, no trading advice — just clean chart structure.
Why this version is unique
Instead of using standard Bollinger visuals, this Fusion edition uses subtle adaptive shading to show when the bands contract.
This makes compression zones instantly visible without overwhelming the chart.
The SMAs are fixed to widely-used trend levels, giving consistent readings across all markets and timeframes.
Who this is for
Newer traders who want a clear introduction to SMAs + Bollinger Bands
Experienced traders who want a lightweight visual tool
Anyone building structure-based strategies
Users of the VectorCoresAI suite who want a simple companion tool
Notes
This indicator is part of the VectorCoresAI Free Tools collection.
All logic is open-source and educational only.
More tools coming soon.
开源脚本
秉承TradingView的精神,该脚本的作者将其开源,以便交易者可以查看和验证其功能。向作者致敬!您可以免费使用该脚本,但请记住,重新发布代码须遵守我们的网站规则。
免责声明
这些信息和出版物并非旨在提供,也不构成TradingView提供或认可的任何形式的财务、投资、交易或其他类型的建议或推荐。请阅读使用条款了解更多信息。
开源脚本
秉承TradingView的精神,该脚本的作者将其开源,以便交易者可以查看和验证其功能。向作者致敬!您可以免费使用该脚本,但请记住,重新发布代码须遵守我们的网站规则。
免责声明
这些信息和出版物并非旨在提供,也不构成TradingView提供或认可的任何形式的财务、投资、交易或其他类型的建议或推荐。请阅读使用条款了解更多信息。