INVITE-ONLY SCRIPT
My LONG and SHORT signals and Bullish and Bearish by seatrips
LONG and SHORT signal generation:
The LONG and SHORT signals in this script are generated based on a combination of sentiment, price strength, and volume strength calculations. The following parameters and calculations are used in determining these signals:
Sentiment: The sentiment is calculated using a Simple Moving Average ( SMA ) of the SMO (oscillator) over a specified sentiment_length.
Price Strength: The price strength is calculated as the percentage change in the closing price compared to the previous closing price.
Volume Strength: The volume strength is calculated as the percentage change in the trading volume compared to the previous trading volume .
Custom Oscillator:This oscillator is calculated as the difference between price strength and volume strength, followed by calculating its SMA over a specified strength_length.
The LONG signal is triggered when:
The sentiment_diff (difference between the oscillator and the SMA oscillator) is greater than 0, and the close price is greater than the fast EMA ( Exponential Moving Average ) of the close price, OR
The custom oscillator crosses over its SMA , and the close price is greater than the open price, and the close price of the previous period is greater than the close price of two periods ago.
The SHORT signal is triggered when:
The sentiment_diff is less than 0, and the close price is less than the fast EMA of the close price, OR
The custom oscillator crosses under its SMA , and the close price is less than the open price, and the close price of the previous period is less than the close price of two periods ago.
Color change description:
The color change in this script is based on the relationship between the close price and the highest/lowest SMAs of the high/low price over a specified lengthInputRoR. The following colors are used:
Green: Bullish area (close price is greater than the highest SMA of the high price)
Red: Bearish area (close price is less than the lowest SMA of the low price)
Yellow: Neutral area (close price is between the highest and lowest SMAs of the high and low prices)
Color meaning description:
Yellow (Neutral Area): This color indicates that the close price is between the highest and lowest SMAs of the high and low prices, signaling more caution and uncertainty in the market.
Green ( Bullish Area): This color represents a bullish market condition where the close price is greater than the highest SMA of the high price, suggesting a higher probability of a successful LONG position.
Red ( Bearish Area): This color signifies a bearish market condition where the close price is less than the lowest SMA of the low price, indicating a higher probability of a successful SHORT position.
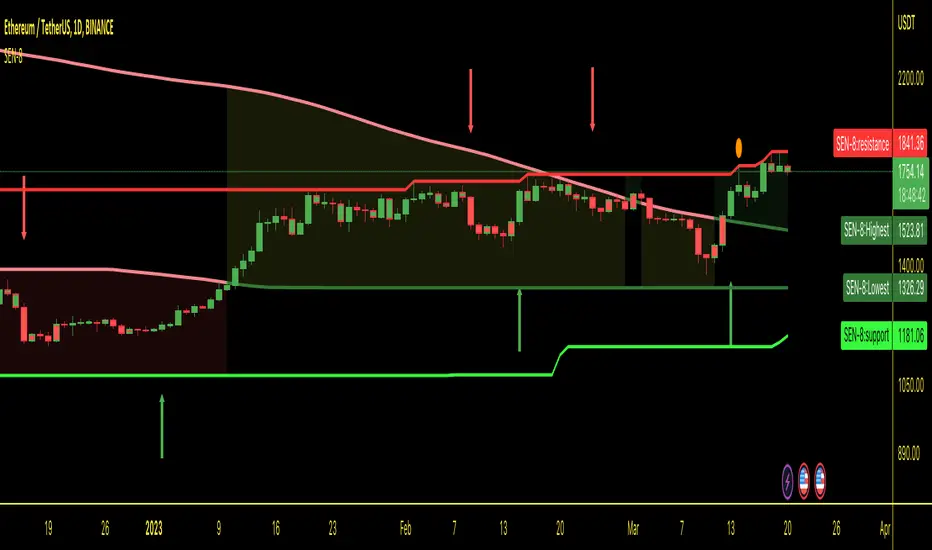
Support and Resistance lines explanation:
Support and resistance lines are calculated based on the highest and lowest prices over a specified number of periods. These lines are used to identify significant price levels where the market may experience increased buying or selling pressure.
Resistance: The resistance line is calculated using the highest high price over a specified number of periods. This line represents a price level where selling pressure is expected to increase, making it more difficult for the price to rise further. Traders often consider resistance levels as potential entry points for SHORT positions or exit points for LONG positions.
Support: The support line is calculated using the lowest low price over a specified number of periods. This line represents a price level where buying pressure is expected to increase, making it more difficult for the price to fall further. Traders often consider support levels as potential entry points for LONG positions or exit points for SHORT positions.
The resistance and support lines are plotted using different colors to help traders visualize the important price levels where the market may experience a reversal or consolidation.
Final Words:
This script provides LONG and SHORT signals and alerts based on a combination of sentiment, price strength, and volume strength calculations. It is designed to serve as a high-quality aid for executing well-informed trading ideas. However, it's important to note that the LONG and SHORT signals and alerts generated by this script should not be considered as trading advice. Traders should always conduct their own research and analysis before making any trading decisions. The script aims to assist in visualizing important market trends and price levels, helping traders make more informed decisions based on their personal trading strategies.
The LONG and SHORT signals in this script are generated based on a combination of sentiment, price strength, and volume strength calculations. The following parameters and calculations are used in determining these signals:
Sentiment: The sentiment is calculated using a Simple Moving Average ( SMA ) of the SMO (oscillator) over a specified sentiment_length.
Price Strength: The price strength is calculated as the percentage change in the closing price compared to the previous closing price.
Volume Strength: The volume strength is calculated as the percentage change in the trading volume compared to the previous trading volume .
Custom Oscillator:This oscillator is calculated as the difference between price strength and volume strength, followed by calculating its SMA over a specified strength_length.
The LONG signal is triggered when:
The sentiment_diff (difference between the oscillator and the SMA oscillator) is greater than 0, and the close price is greater than the fast EMA ( Exponential Moving Average ) of the close price, OR
The custom oscillator crosses over its SMA , and the close price is greater than the open price, and the close price of the previous period is greater than the close price of two periods ago.
The SHORT signal is triggered when:
The sentiment_diff is less than 0, and the close price is less than the fast EMA of the close price, OR
The custom oscillator crosses under its SMA , and the close price is less than the open price, and the close price of the previous period is less than the close price of two periods ago.
Color change description:
The color change in this script is based on the relationship between the close price and the highest/lowest SMAs of the high/low price over a specified lengthInputRoR. The following colors are used:
Green: Bullish area (close price is greater than the highest SMA of the high price)
Red: Bearish area (close price is less than the lowest SMA of the low price)
Yellow: Neutral area (close price is between the highest and lowest SMAs of the high and low prices)
Color meaning description:
Yellow (Neutral Area): This color indicates that the close price is between the highest and lowest SMAs of the high and low prices, signaling more caution and uncertainty in the market.
Green ( Bullish Area): This color represents a bullish market condition where the close price is greater than the highest SMA of the high price, suggesting a higher probability of a successful LONG position.
Red ( Bearish Area): This color signifies a bearish market condition where the close price is less than the lowest SMA of the low price, indicating a higher probability of a successful SHORT position.
Support and Resistance lines explanation:
Support and resistance lines are calculated based on the highest and lowest prices over a specified number of periods. These lines are used to identify significant price levels where the market may experience increased buying or selling pressure.
Resistance: The resistance line is calculated using the highest high price over a specified number of periods. This line represents a price level where selling pressure is expected to increase, making it more difficult for the price to rise further. Traders often consider resistance levels as potential entry points for SHORT positions or exit points for LONG positions.
Support: The support line is calculated using the lowest low price over a specified number of periods. This line represents a price level where buying pressure is expected to increase, making it more difficult for the price to fall further. Traders often consider support levels as potential entry points for LONG positions or exit points for SHORT positions.
The resistance and support lines are plotted using different colors to help traders visualize the important price levels where the market may experience a reversal or consolidation.
Final Words:
This script provides LONG and SHORT signals and alerts based on a combination of sentiment, price strength, and volume strength calculations. It is designed to serve as a high-quality aid for executing well-informed trading ideas. However, it's important to note that the LONG and SHORT signals and alerts generated by this script should not be considered as trading advice. Traders should always conduct their own research and analysis before making any trading decisions. The script aims to assist in visualizing important market trends and price levels, helping traders make more informed decisions based on their personal trading strategies.
CJ
免责声明
这些信息和出版物并不意味着也不构成TradingView提供或认可的金融、投资、交易或其它类型的建议或背书。请在使用条款阅读更多信息。