OPEN-SOURCE SCRIPT
Unsurpassed Close Levels
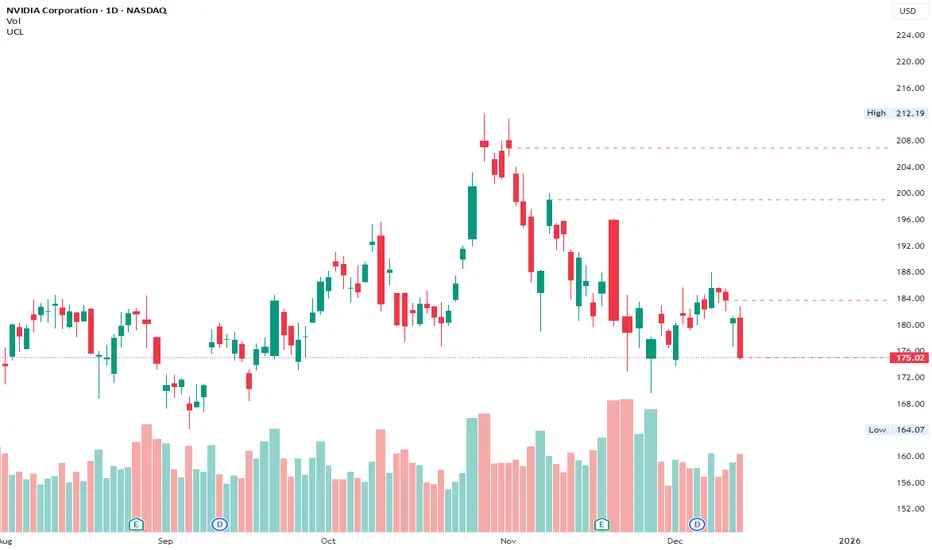
This indicator identifies and visually highlights previous candle close prices that have not yet been surpassed by any subsequent higher high — creating dynamic horizontal resistance levels based purely on closing prices.
How it works:
For every confirmed candle, a dashed horizontal ray is drawn from its close price extending to the right.
The ray remains visible as long as no future candle's high reaches or exceeds that previous close level.
As soon as price makes a new high that touches or surpasses the level, the ray is automatically removed.
Duplicate levels (exact same close price already active) are skipped to keep the chart clean.
A built-in limit of 50 active levels prevents overload on very long timeframes.
Use cases:
Spot potential resistance zones formed by previous closes that price has failed to reclaim on the upside.
Helpful in downtrends or ranging markets to visualize "overhead supply" levels where sellers previously stepped in at the close.
Great complement to traditional swing highs or supply/demand zones — focuses exclusively on close-based resistance.
Works on any timeframe and any instrument.
Visuals:
Dashed red horizontal rays extending right from unsurpassed closes.
Clean and lightweight — lines disappear automatically when invalidated.
Simple, effective, and fully automatic. No inputs required.
Feel free to customize the color, style, or max levels count in the code if desired.
开源脚本
秉承TradingView的精神,该脚本的作者将其开源,以便交易者可以查看和验证其功能。向作者致敬!您可以免费使用该脚本,但请记住,重新发布代码须遵守我们的网站规则。
免责声明
这些信息和出版物并非旨在提供,也不构成TradingView提供或认可的任何形式的财务、投资、交易或其他类型的建议或推荐。请阅读使用条款了解更多信息。
免责声明
这些信息和出版物并非旨在提供,也不构成TradingView提供或认可的任何形式的财务、投资、交易或其他类型的建议或推荐。请阅读使用条款了解更多信息。