OPEN-SOURCE SCRIPT
Statistical Trend Analysis (Scatterplot) [BigBeluga]
Statistical Trend Analysis (Scatterplot) [BigBeluga] provides a unique perspective on market dynamics by combining the statistical concept of z-scores with scatterplot visualization to assess price momentum and potential trend shifts.
🧿What is Z-Score?
🧿Key Features:
Scatterplot Visualization:
Displays data points of z-score and its change across four quadrants.

Quadrants help interpret market conditions:
Color-Coded Candles:
Z-Score Time Series:
🧿Usage:
This tool is ideal for traders who rely on statistical insights to confirm trends, detect potential reversals, and assess market momentum visually and quantitatively.
🧿What is Z-Score?
- Definition: A z-score is a statistical measure that quantifies how far a data point is from the mean, expressed in terms of standard deviations.
- In this Indicator:
- A high positive z-score indicates the price is significantly above the average.
- A low negative z-score indicates the price is significantly below the average.
- The indicator also calculates the rate of change of the z-score, helping identify momentum shifts in the market.
🧿Key Features:
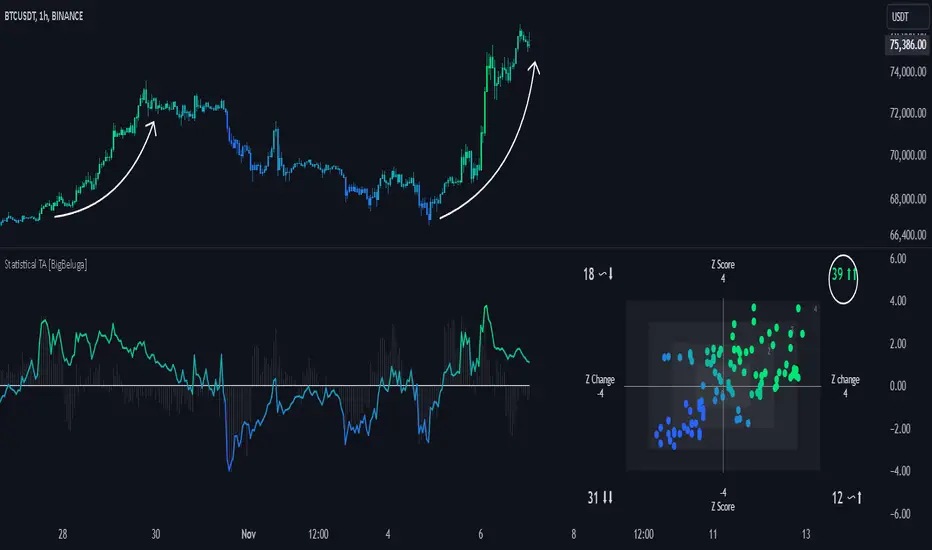
Scatterplot Visualization:
Displays data points of z-score and its change across four quadrants.
Quadrants help interpret market conditions:
- Upper Right (Strong Bullish Momentum): Most data points here signal an ongoing uptrend.
- Upper Left (Weakening Momentum): Data points here may indicate a potential market shift or ranging market.
- Lower Left (Strong Bearish Momentum): Indicates a dominant downtrend.
- Lower Right (Trend Shift to Bullish/Ranging): Suggests weakening bearish momentum or an emerging uptrend.
Color-Coded Candles:
- Candles are dynamically colored based on the z-score, providing a visual cue about the price's deviation from the mean.
Z-Score Time Series:
- A line plot of z-scores over time shows price deviation trends.
- A gray histogram displays the rate of change of the z-score, highlighting momentum shifts.
🧿Usage:
- Use the scatterplot and quadrant gauges to understand the current market momentum and potential shifts.
- Monitor the z-score line plot to identify overbought/oversold conditions.
- Utilize the gray histogram to detect momentum reversals and trend strength.
This tool is ideal for traders who rely on statistical insights to confirm trends, detect potential reversals, and assess market momentum visually and quantitatively.
开源脚本
秉承TradingView的精神,该脚本的作者将其开源,以便交易者可以查看和验证其功能。向作者致敬!您可以免费使用该脚本,但请记住,重新发布代码须遵守我们的网站规则。
🔵Gain access to our powerful tools : bigbeluga.com/tv
🔵Join our free discord for updates : bigbeluga.com/discord
All scripts & content provided by BigBeluga are for informational & educational purposes only.
🔵Join our free discord for updates : bigbeluga.com/discord
All scripts & content provided by BigBeluga are for informational & educational purposes only.
免责声明
这些信息和出版物并非旨在提供,也不构成TradingView提供或认可的任何形式的财务、投资、交易或其他类型的建议或推荐。请阅读使用条款了解更多信息。