PROTECTED SOURCE SCRIPT
已更新 Base Finder
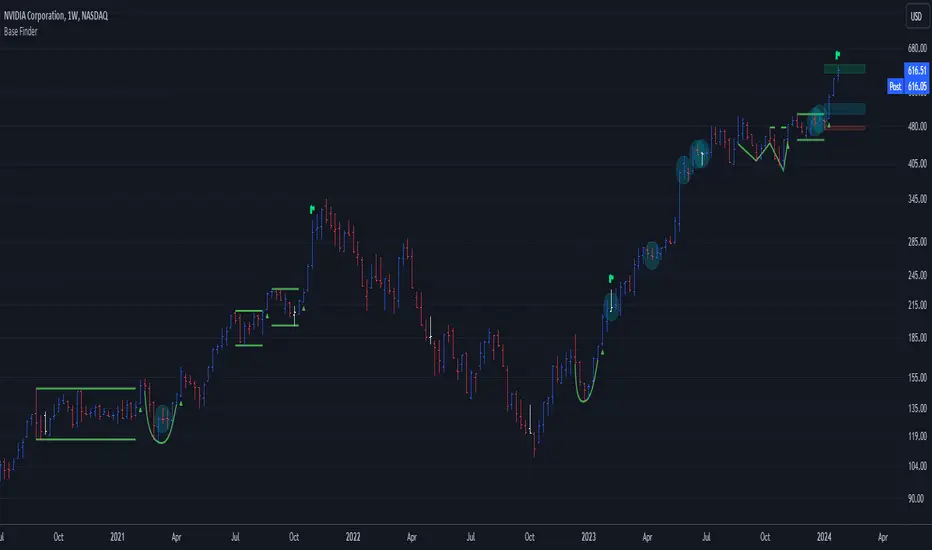
The Base Finder is a powerful tool to identify consolidation periods in a stock's advance. With this indicator, traders can effortlessly spot consolidation patterns on their charts providing them with a deeper understanding of the stock's price action.
Base Finder goes beyond identifying consolidation patterns, as it also offers key information about the consolidation such as the depth, length, pivot point, and the number of accumulation or distribution weeks throughout the pattern. This information allows traders to compare and analyze the best basing patterns quickly and easily.

With Base Finder, traders can differentiate between a Flat Base, a High Tight Flag, or a consolidation, like a cup with handle or double bottom base.

This tool helps traders of all levels train their eye to identify potential trading opportunities that might have otherwise gone unnoticed.
Base Finder is a must-have tool for any trader, especially those that have studied the work of William O’Neil. Base Finder stacks up base for base with MarketSmith.

Easily customize the settings, from the look to the intricacies of a consolidation.

Default base and accumulation/distribution settings:
Flat Base
High Tight Flag
Consolidation:
Accumulation Week:
Current candle closes lower, but in the upper half of the weekly closing range on above average volume. OR Current candle closes positive in the upper 40% of the weekly closing range on above average volume.
Distribution Week:
Current candle closes positive, but in the lower quartile of the weekly closing range on above average volume. OR Current candle closes down on the week in the lower half of the weekly closing range on above average volume.
Notes
This indicator is meant to be used on the weekly timeframe.
In order to see the stats labels hover your mouse over the left side high of the consolidation and please make sure the indicator is brought to the front using the visual order of your chart. If the visual order is not correct you will not be able to see the stats label.
Disclaimer:
This indicator is for informational and educational purposes only. Do your own research before making any trade decisions. We accept no liability for any loss or damage, including without limitation any loss of profit, which may arise directly or indirectly from use of or reliance on this indicator.
Base Finder goes beyond identifying consolidation patterns, as it also offers key information about the consolidation such as the depth, length, pivot point, and the number of accumulation or distribution weeks throughout the pattern. This information allows traders to compare and analyze the best basing patterns quickly and easily.
With Base Finder, traders can differentiate between a Flat Base, a High Tight Flag, or a consolidation, like a cup with handle or double bottom base.
This tool helps traders of all levels train their eye to identify potential trading opportunities that might have otherwise gone unnoticed.
Base Finder is a must-have tool for any trader, especially those that have studied the work of William O’Neil. Base Finder stacks up base for base with MarketSmith.
Easily customize the settings, from the look to the intricacies of a consolidation.
Default base and accumulation/distribution settings:
Flat Base
- length: 5 weeks minimum
- depth: <= 15%
High Tight Flag
- Flag Pole: up 80% or more in less than 8 weeks
- Flag: Less than 25% correction in 2-4 weeks
Consolidation:
- length: minimum 6 weeks
- depth: <= 35%
Accumulation Week:
Current candle closes lower, but in the upper half of the weekly closing range on above average volume. OR Current candle closes positive in the upper 40% of the weekly closing range on above average volume.
Distribution Week:
Current candle closes positive, but in the lower quartile of the weekly closing range on above average volume. OR Current candle closes down on the week in the lower half of the weekly closing range on above average volume.
Notes
This indicator is meant to be used on the weekly timeframe.
In order to see the stats labels hover your mouse over the left side high of the consolidation and please make sure the indicator is brought to the front using the visual order of your chart. If the visual order is not correct you will not be able to see the stats label.
Disclaimer:
This indicator is for informational and educational purposes only. Do your own research before making any trade decisions. We accept no liability for any loss or damage, including without limitation any loss of profit, which may arise directly or indirectly from use of or reliance on this indicator.
版本注释
Fixed a typo in the settings menu版本注释
Small change to the way Accumulation and Distribution week counter resets版本注释
Fixed a typo版本注释
New Features✅ Show & alert breakouts
✅ Alerts for new bases
✅ Adjustable prior uptrend minimums
版本注释
Fixed a small bug removing bases prematurely 版本注释
Fixed a small typo in the alert dialogue 版本注释
Fixed a bug making some High Tight Flag Poles longer than 8 weeks版本注释
Added agility to see cups and customizable profit / stop zones. 版本注释
Fixed a small bug in the latest release版本注释
With this latest update, Base Finder is raising the bar, taking pattern recognition to another level. The new version Base Finder not only finds consolidations, but also now has the ability to show the following:
- Cup with Handles
- Base Stages
- Heavy Volume Without Further Price Progress
- 3 Weeks Tight
- Base Flaws
- Profit Target Reached / 8 Week Hold Rule Flag
- Sell Signals
- Base Health Table
Flaws include living below the 10 week moving average and wedging handles. Sell signals include Railroad Tracks, Climax Tops, 2 Weeks Down 2 Weeks Up and Bad Break of 10 Week.
版本注释
small fix版本注释
Update includes multi timeframe support and double bottom bases. Base Finder and Base Finder Daily have been merged, combining both daily and weekly time frame capabilities.
Double bottom bases are also now recognized.
版本注释
Fixed the average volume length on the daily time frame. 版本注释
Added the starting date of the base to the Base Health Table版本注释
Fixed a small bug when the breakout occurs at the same time as the maximum base length setting is reached. 版本注释
Added ability to recognize short stroke add on patterns on the weekly time frame. A short stroke forms over just two weeks
The first week is marked by a very sharp advance, 10% or greater, followed by a tight range in the second week. Volume should be lower in the second week than in the first, and the stock typically doesn't eclipse the first week's high.
版本注释
Base Finder now identifies Ants. Ants can be toggled on or off in the settings menu.Ants are based on David Ryan's study of what made some stocks to superior moves higher from their bases, while others only made modest gains.
David identified 3 key characteristics:
- The stock was up 12 or more of the past 15 days
- Volume was up 20% or more over the past 15 days
- Price was up at least 20% over the past 15 days
Ants are displayed on the chart as small boxes over the high of candles. By hovering over the most recent "ant", you can view a data label displaying the following details:
- How many days of the last 15 days were up
- The price gain of the last 15 days
- The % volume was above average for the last 15 days
*Ants are only displayed on a daily timeframe
版本注释
Update to Cup With Handle on daily time frame. 版本注释
Update has a setting to allow the base info labels to always be visible. Default setting is only visible when hovering over the high of the first bar of the base. 版本注释
update to climax top sell signal版本注释
bug fix版本注释
Update to work with the new Pine Screener版本注释
Update to work with the new Pine Screener版本注释
distance to pivot added for screening版本注释
Bars since breakout added for Pine Screener and RS days added back into the base health table版本注释
By popular request I added 4 moving averages.受保护脚本
此脚本以闭源形式发布。 但是,您可以自由使用,没有任何限制 — 了解更多信息这里。
Trusted Pine programmer. Send me a message for script development.
免责声明
这些信息和出版物并非旨在提供,也不构成TradingView提供或认可的任何形式的财务、投资、交易或其他类型的建议或推荐。请阅读使用条款了解更多信息。
受保护脚本
此脚本以闭源形式发布。 但是,您可以自由使用,没有任何限制 — 了解更多信息这里。
Trusted Pine programmer. Send me a message for script development.
免责声明
这些信息和出版物并非旨在提供,也不构成TradingView提供或认可的任何形式的财务、投资、交易或其他类型的建议或推荐。请阅读使用条款了解更多信息。