PROTECTED SOURCE SCRIPT
已更新 Financial Label
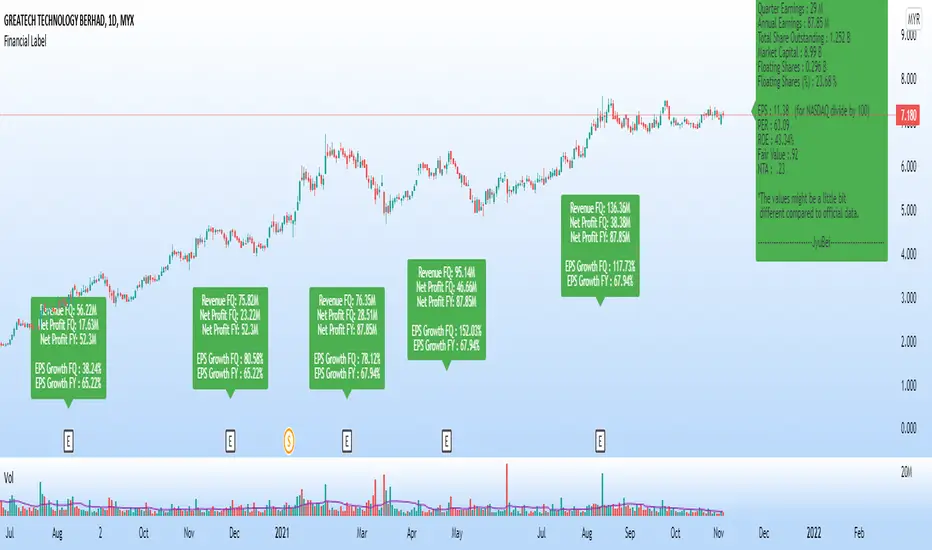
5 Magic Numbers, C, A & S (for CANSLIM) in 1 label.
This label shows:
1. Latest Quarter Earnings (QR)
2. Annual Earnings (AR)
3. Total Share Outstanding
4. Market Capital
5. Floating Shares
6. Earning per Share (EPS)
7. Price per Earning Ratio (P/E Ratio @ PER)
8. Return On Equity (ROE)
9. Fair Value (FV)
10. Non Tangible Asset (NTA)
This label will show the data only on charts that have financial data only.
Warrants, futures, crypto, etc. will not have any display on this label.
Suitable for all markets including US, Asia, Europe and others.
Thus, no currency symbol ($,¥,€, RM, etc.) will be displayed, only numbers.
Green label means EPS is positive - profitable company.
Red label means EPS is negative - loss making company.
Note:
1. The values might be a little bit different from official data, due to type of data taken & calculations, as we have a few formulas for each data.
2. Please confirm more accurate data from your trusted and official source of data.
版本注释
Additional1. Floating share in percent (%)
2. Quarter Report (QR/FQ) data
i. Revenue FQ
ii. Net profit FQ
iii. Net profit FY
iv. EPS Growth FQ
v. EPS Growth FY
* If Net Profit is POSITIVE, the label will be in GREEN.
** If Net Profit is NEGATIVE, the label will be in RED.
Changes:
1. Earnings are in Million (M)
2. Shares are in Billion (B)
Note:
1. For US market, the EPS value need to divide by 100. This number is close to the values in finvis.com (my reference)
2. The values might be different from other source of data. Please use as quick reference, not main reference.
受保护脚本
此脚本以闭源形式发布。 但是,您可以自由使用,没有任何限制 — 了解更多信息这里。
免责声明
这些信息和出版物并非旨在提供,也不构成TradingView提供或认可的任何形式的财务、投资、交易或其他类型的建议或推荐。请阅读使用条款了解更多信息。
免责声明
这些信息和出版物并非旨在提供,也不构成TradingView提供或认可的任何形式的财务、投资、交易或其他类型的建议或推荐。请阅读使用条款了解更多信息。