PROTECTED SOURCE SCRIPT
已更新 (mab) Divergences
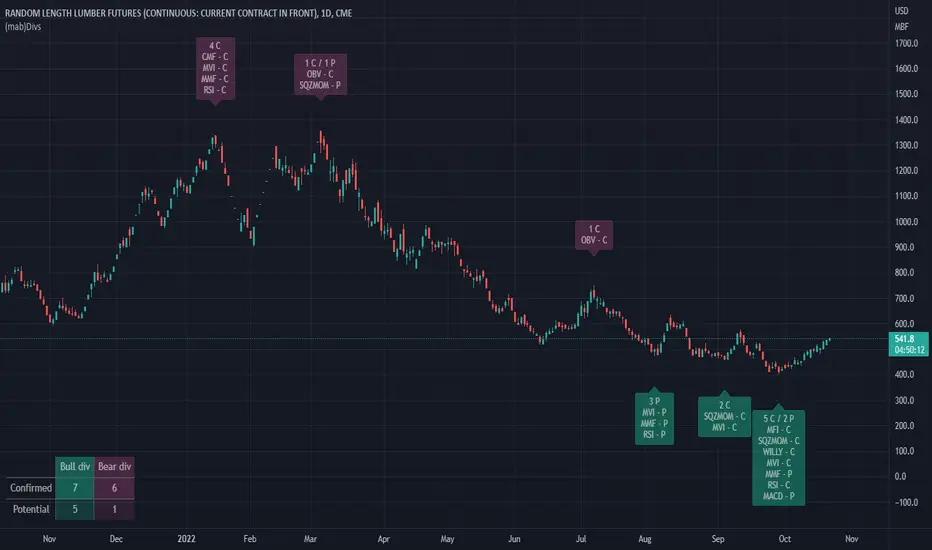
This overlay indicator detects divergences between price movement and a number of price, volume and combined price-volume indicators.
In contrast to other scripts which can detect divergences, this indicator re-evaluates the status of each divergence at every confirmed candle. Divergences are potential when they are first detected. They can later be confirmed if the indicator value crosses the confirmation level. They can be invalidated before or after confirmation if the indicator value crosses the invalidation level.
Potential divergences are good bullish or bearish signals. However, confirmed divergences are much more significant and powerful. Invalidated divergences on the other hand shouldn't be considered as any signal anymore, that's why the are removed from the display by default.
The chart below illustrates confirmation and invalidation levels.

Bullish divergences:
- Potential bullish divergence: Price in downtrend making a lower low (pivot point D lower than pivot point B) while the indicator makes a higher low (pivot point D higher than pivot point B)
- Confirmed bullish divergence: The indicator value moves above the previous high (indicator value E higher than confirmation level C)
- Invalidated bullish divergence: The indicator value moves below the previous low (indicator value lower than invalidation level D). Divergences can be invalidated at any point, before or after
confirmation.
Bearish divergences:
- Potential bearish divergence: Price in uptrend making a higher high (pivot point D higher than pivot point B) while the indicator makes a lower high (pivot point D lower than pivot point B)
- Confirmed bearish divergence: The indicator value moves below the previous low (indicator value E lower than confirmation level C)
- Invalidated bearish divergence: The indicator value moves above the previous high (indicator value higher than invalidation level D). Divergences can be invalidated at any point, before or after
confirmation.
Divergences for the following price and volume indicators are implemented:
- MACD , Moving Averages Convergence Divergence, modified default configuration
- RSI , Relative Strength Index
- MMF, (mab) Money Flow , my proprietary money flow index using price and volume data and a formula similar to RSI
- MVI , (mab) Volume Index, my proprietary volume index using a formula similar to RSI
- Willy, a Williams %R, modified default configuration
- SqzMom, Squeeze Momentum, the momentum indicator of Squeeze Pro (John Carter)
- CMF , Chaikin Money Flow
- MFI , Money Flow Index
- OBV, On-balance Volume
V 0.9
© happymab
In contrast to other scripts which can detect divergences, this indicator re-evaluates the status of each divergence at every confirmed candle. Divergences are potential when they are first detected. They can later be confirmed if the indicator value crosses the confirmation level. They can be invalidated before or after confirmation if the indicator value crosses the invalidation level.
Potential divergences are good bullish or bearish signals. However, confirmed divergences are much more significant and powerful. Invalidated divergences on the other hand shouldn't be considered as any signal anymore, that's why the are removed from the display by default.
The chart below illustrates confirmation and invalidation levels.
Bullish divergences:
- Potential bullish divergence: Price in downtrend making a lower low (pivot point D lower than pivot point B) while the indicator makes a higher low (pivot point D higher than pivot point B)
- Confirmed bullish divergence: The indicator value moves above the previous high (indicator value E higher than confirmation level C)
- Invalidated bullish divergence: The indicator value moves below the previous low (indicator value lower than invalidation level D). Divergences can be invalidated at any point, before or after
confirmation.
Bearish divergences:
- Potential bearish divergence: Price in uptrend making a higher high (pivot point D higher than pivot point B) while the indicator makes a lower high (pivot point D lower than pivot point B)
- Confirmed bearish divergence: The indicator value moves below the previous low (indicator value E lower than confirmation level C)
- Invalidated bearish divergence: The indicator value moves above the previous high (indicator value higher than invalidation level D). Divergences can be invalidated at any point, before or after
confirmation.
Divergences for the following price and volume indicators are implemented:
- MACD , Moving Averages Convergence Divergence, modified default configuration
- RSI , Relative Strength Index
- MMF, (mab) Money Flow , my proprietary money flow index using price and volume data and a formula similar to RSI
- MVI , (mab) Volume Index, my proprietary volume index using a formula similar to RSI
- Willy, a Williams %R, modified default configuration
- SqzMom, Squeeze Momentum, the momentum indicator of Squeeze Pro (John Carter)
- CMF , Chaikin Money Flow
- MFI , Money Flow Index
- OBV, On-balance Volume
V 0.9
© happymab
版本注释
V 1.0- Fixed: Labels with only invalidated divs have been shown as empty labels
- Fixed: "Maximum number of bull/bear div labels" is now working
版本注释
Version 1.1- Improvement: Redesign of data storage for divergences and pivots using custom types and arrays of custom types. Refactoring of code to process pivots and divergences.
- Enhancement: Alerts for divergence and pivot events
受保护脚本
此脚本以闭源形式发布。 但是,您可以自由使用,没有任何限制 — 了解更多信息这里。
免责声明
这些信息和出版物并非旨在提供,也不构成TradingView提供或认可的任何形式的财务、投资、交易或其他类型的建议或推荐。请阅读使用条款了解更多信息。
免责声明
这些信息和出版物并非旨在提供,也不构成TradingView提供或认可的任何形式的财务、投资、交易或其他类型的建议或推荐。请阅读使用条款了解更多信息。