PROTECTED SOURCE SCRIPT
已更新 Black Arrow
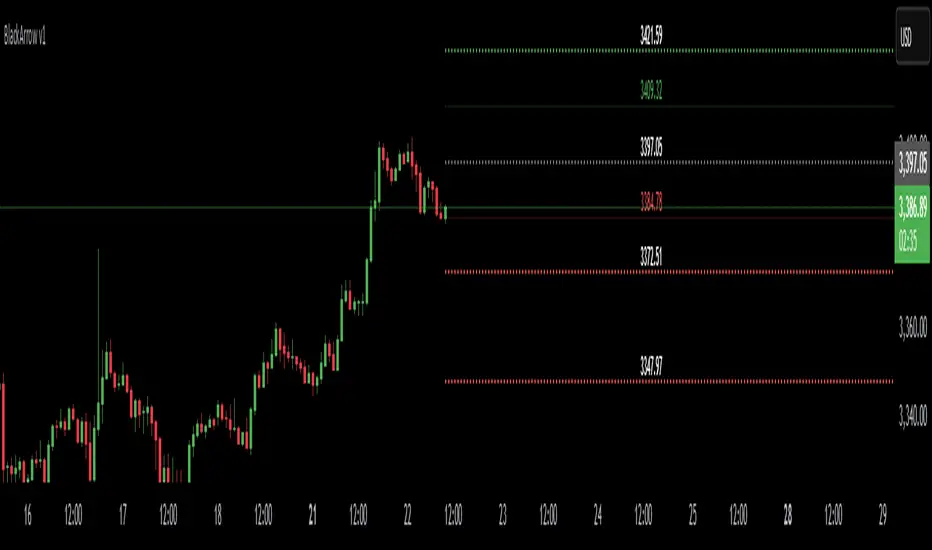
Expected Move Levels - Closer Prices
This script calculates and displays the expected move based on Implied Volatility (IV) and Days to Expiration (DTE). It helps traders visualize potential price movement ranges over a defined period using historical close price.
🔹 Key Features:
Customizable IV and DTE inputs
Displays 2 green levels above price and 2 red levels below, representing half and full expected move
Mid-lines between base price and first green/red level
Each level is labeled with its price value
Lines are drawn short and don't extend through the full chart for clarity
📘 Formula:
Expected Move = Price × IV × √(DTE / 365)
Use this tool to estimate market volatility zones and potential price targets without relying on traditional indicators.
版本注释
..版本注释
update受保护脚本
此脚本以闭源形式发布。 但是,您可以自由使用,没有任何限制 — 了解更多信息这里。
免责声明
这些信息和出版物并非旨在提供,也不构成TradingView提供或认可的任何形式的财务、投资、交易或其他类型的建议或推荐。请阅读使用条款了解更多信息。
受保护脚本
此脚本以闭源形式发布。 但是,您可以自由使用,没有任何限制 — 了解更多信息这里。
免责声明
这些信息和出版物并非旨在提供,也不构成TradingView提供或认可的任何形式的财务、投资、交易或其他类型的建议或推荐。请阅读使用条款了解更多信息。