OPEN-SOURCE SCRIPT
Historical Volatility (adjustable time period)
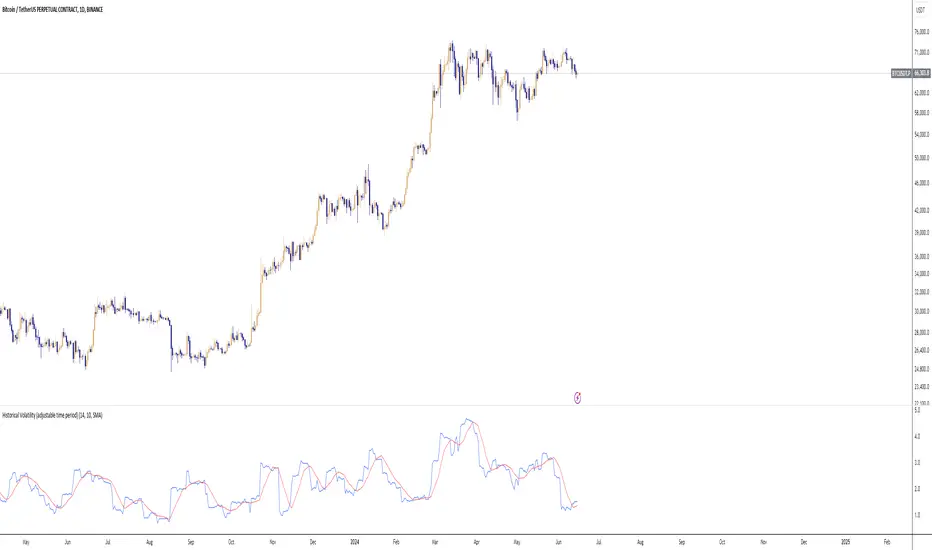
Historical Volatility with Adjustable Time Period and Moving Average
This indicator calculates the historical volatility of an asset within a user-defined date range. Volatility is a measure of the dispersion of returns and is commonly used to assess the risk and potential price fluctuations of an asset.
How It Works
User-Defined Date Range: You can specify the start and end dates to focus on a particular period for volatility calculation. This is useful for analyzing specific historical events or trends within a defined timeframe.
Daily Returns Calculation: The script calculates the daily returns as the percentage change between the current close price and the previous close price. This percentage change is essential for determining the asset's volatility.
Volatility Calculation: The historical volatility is computed as the standard deviation of the daily returns over a specified period. The standard deviation is a statistical measure that quantifies the amount of variation or dispersion in a set of values.
Moving Average: An optional feature allows you to plot a moving average of the volatility. You can customize the type (SMA, EMA, WMA, VWMA) and the period of the moving average, helping to smooth out the volatility data and identify trends.
Indicator Settings
Start Date: Select the beginning date of the period for which you want to calculate volatility.
End Date: Select the end date of the period.
Period: Set the number of bars (days) over which to calculate the average volatility.
Show Moving Average: Toggle to display the moving average of the volatility.
Moving Average Period: Define the length of the moving average.
Moving Average Type: Choose the type of moving average: Simple (SMA), Exponential (EMA), Weighted (WMA), or Volume-Weighted (VWMA).
How to Use
Configure Date Range: Set the start and end dates to focus on the specific historical period you are interested in.
Adjust Period for Volatility Calculation: Select the period over which you want to calculate the average volatility. A shorter period will be more sensitive to recent price changes, while a longer period will provide a more smoothed view.
Enable and Configure Moving Average: If desired, enable the moving average and select the type and period that best fits your analysis style.
Example Use Cases
Market Analysis: Identify periods of high or low volatility to assess market conditions.
Risk Management: Use historical volatility to evaluate the risk associated with a particular asset.
Event Impact: Analyze how specific events within the selected date range affected the asset's volatility.
By providing these functionalities, this indicator is a valuable tool for traders looking to understand and analyze the volatility of assets over custom time periods with the flexibility of adding a moving average for trend analysis.
开源脚本
秉承TradingView的精神,该脚本的作者将其开源,以便交易者可以查看和验证其功能。向作者致敬!您可以免费使用该脚本,但请记住,重新发布代码须遵守我们的网站规则。
免责声明
这些信息和出版物并非旨在提供,也不构成TradingView提供或认可的任何形式的财务、投资、交易或其他类型的建议或推荐。请阅读使用条款了解更多信息。
开源脚本
秉承TradingView的精神,该脚本的作者将其开源,以便交易者可以查看和验证其功能。向作者致敬!您可以免费使用该脚本,但请记住,重新发布代码须遵守我们的网站规则。
免责声明
这些信息和出版物并非旨在提供,也不构成TradingView提供或认可的任何形式的财务、投资、交易或其他类型的建议或推荐。请阅读使用条款了解更多信息。