OPEN-SOURCE SCRIPT
CAGR + Log Slope Color
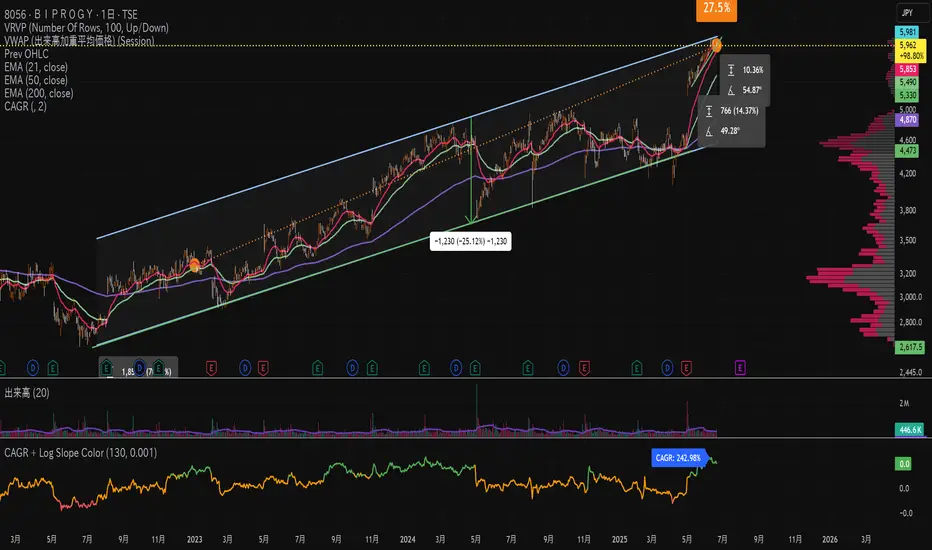
This custom TradingView indicator combines two important analytical concepts to help traders identify strong trends with visual clarity:
CAGR (Compound Annual Growth Rate):
Measures the geometric average annual return of the asset over a specified period. It smooths out short-term fluctuations and provides a long-term growth perspective.
Logarithmic Slope Coloring:
The slope of the log-scaled price is calculated and visualized with color gradients. Steeper upward slopes indicate stronger momentum and are highlighted with more intense colors. Downward slopes are shown in contrasting colors for easier identification of bearish trends.
开源脚本
秉承TradingView的精神,该脚本的作者将其开源,以便交易者可以查看和验证其功能。向作者致敬!您可以免费使用该脚本,但请记住,重新发布代码须遵守我们的网站规则。
免责声明
这些信息和出版物并非旨在提供,也不构成TradingView提供或认可的任何形式的财务、投资、交易或其他类型的建议或推荐。请阅读使用条款了解更多信息。
开源脚本
秉承TradingView的精神,该脚本的作者将其开源,以便交易者可以查看和验证其功能。向作者致敬!您可以免费使用该脚本,但请记住,重新发布代码须遵守我们的网站规则。
免责声明
这些信息和出版物并非旨在提供,也不构成TradingView提供或认可的任何形式的财务、投资、交易或其他类型的建议或推荐。请阅读使用条款了解更多信息。