PROTECTED SOURCE SCRIPT
9-Candle Pattern + Support & Resistance
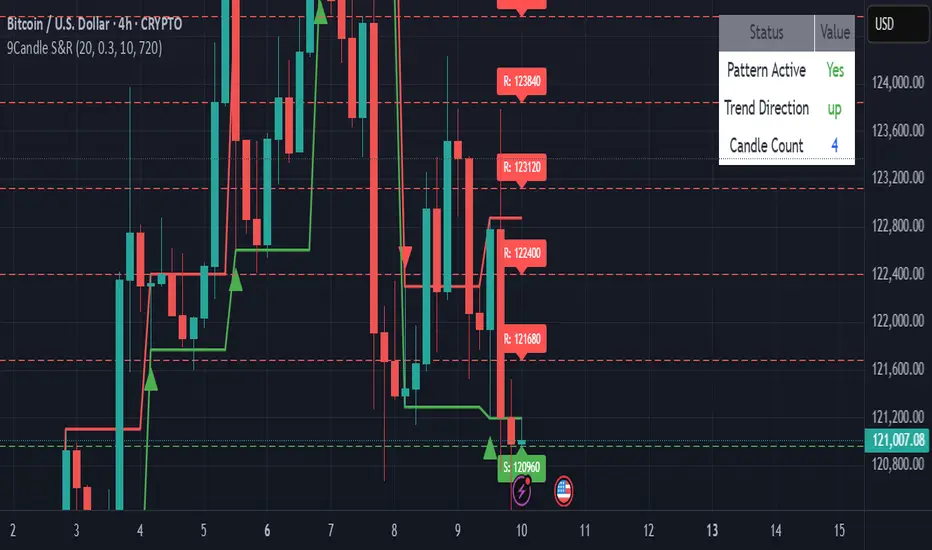
9-Candle Pattern + Support & Resistance Indicator
The 9-Candle Pattern + Support & Resistance indicator is a powerful technical analysis tool designed to identify short-term reversal patterns and key price levels on any chart. It combines candlestick pattern recognition with dynamic support and resistance zones, providing traders with actionable entry and exit signals.
Key Features
🔹 9-Candle Pattern Detection:
Automatically scans the chart for a 9-candle formation that often precedes potential trend reversals or breakout opportunities.
The pattern highlights price exhaustion zones where momentum is likely to shift.
🔹 Automatic Support & Resistance Levels:
Plots real-time support and resistance zones based on recent swing highs and lows, helping traders spot crucial decision points on the chart.
🔹 Multi-Timeframe Compatibility:
Works seamlessly across multiple timeframes, from intraday scalping to swing trading setups.
🔹 Custom Alerts:
Receive alerts when a valid 9-candle reversal pattern forms near a key support or resistance level — increasing the accuracy of trade confirmations.
🔹 Visual Clarity:
Clean visual cues for patterns and zones, making chart analysis intuitive without clutter.
How It Helps
This indicator simplifies technical analysis by merging price action logic with market structure awareness.
Traders can quickly identify:
Potential reversal zones
Breakout opportunities
High-probability entries aligned with strong S/R levels
Best For
Price action traders
Swing and intraday traders
Traders using confluence-based strategies
受保护脚本
此脚本以闭源形式发布。 但是,您可以自由使用它,没有任何限制 — 在此处了解更多信息。
免责声明
这些信息和出版物并不意味着也不构成TradingView提供或认可的金融、投资、交易或其它类型的建议或背书。请在使用条款阅读更多信息。
受保护脚本
此脚本以闭源形式发布。 但是,您可以自由使用它,没有任何限制 — 在此处了解更多信息。
免责声明
这些信息和出版物并不意味着也不构成TradingView提供或认可的金融、投资、交易或其它类型的建议或背书。请在使用条款阅读更多信息。